Transmission Line Zo vs. Frequency
© Brooke Clarke, N6GCE 2003 - 2019Background
Basics
Ohm's Law
A.C. Impedance
Zo Characteristic Impedance
High Frequency Impedance
Low Frequency Impedance
Corner Frequency
Examples
Open Wire Phone Lines
CAT5 Wire Measurements
RG-58 50 Ohm Coax Measurements
500 Dial Phone Line Impedance
Patent
Links
Basics
Ohm's Law
A.C. Impedance
Zo Characteristic Impedance
High Frequency Impedance
Low Frequency Impedance
Corner Frequency
Examples
Open Wire Phone Lines
CAT5 Wire Measurements
RG-58 50 Ohm Coax Measurements
500 Dial Phone Line Impedance
Patent
Links
Background
When reading the literature on telephones, the subscriber loop line impedance is often given as 600 or 900 Ohms. This seemed correct for the open wire lines that used glass insulators on poles but not for modern unshielded twisted Pairs (UTP) which have an advertised impedance of about 100 Ohms.
It turns out the the "100 Ohm" UTP cable does have a characteristic impedance near 600 Ohms at 1 kHz.
Why's This Important
To get maximum power transfer though a long cable you need to be operating in a matched condition.
Basics
A transmission line has a constant line impedance (Zo) when operated well above it's corner frequency. This is the published Zo line impedance value.
Well below the corner frequency the line impedance increases one order of magnitude for each two decades of frequency decrease.
This is not caused by variation in the resistance of the wire or by changes in the dielectric constant of the insulation, but rather it's just a result of the math for the impedance.
Ohm's Law
For DC Ohm's law says R = V / I where all three numbers are scalars, i.e., no magnitude and angles.
A.C. Impedance
For A.C. sine waves the impedance is Z = V / I where all three numbers are complex.
Zo Characteristic Impedance
The characteristic impedance of a line is the impedance you would see at one end of a transmission line of infinite length.
Zo =SQRT [ (R + 2 * PI * F * L*j) / (G + 2 * PI * F * C*j) ] Equation 1
where:
Zo is the complex line impedance.
Zo is independent of the line length. Adding two lines in series with the same Zo results in the same Zo.R is the series resistance per unit length
mainly due to copper loss, so many Ohms per footL is the series inductance per unit length
second order increase due to the skin effect causing an increase of resistance with frequency
due to the length and configuration of a conductor, so many uH per footG is the conductance (1/resistance) per unit length
is significant for very high frequencies where the dielectric losses show up,C is the capacitance per unit length, due to conductors separated by a dielectric
but can be considered 0 (infinite resistance) at low frequencies.
is important at all frequencies.j is the square root of -1.
High Frequency Impedance
This is the classical "lossless" transmission line impedance. You can see by inspection of Equation 1 that if both loss terms (R and G) are removed you're left with Equation 2. But Equation 2 also applies for the case where the line has loss, like real phone exchange lines that are operating above the corner frequency.
At frequencies well above the line corner frequency the reactive components of Equation 1 swamp the real parts leaving the following equation:
Zo = SQRT[ L / C] Equation 2
Where Zo, L and C are the same as for Equation 1 above.
Note that since L and C are both in terms of unit length, the unit length cancels out making Zo independent of length.
Also note that the "j" terms in the numerator and denominator cancel out, so the phase angle will be 0 degrees, i.e. the impedance is real.
Low Frequency Impedance
At low frequencies Equation 1 simplifies to:
Zo = SQRT[ R / (2 * PI * F * C * j) ] Equation 3
Where Zo, R and C are the same as for Equation 1.
Note the "j" means this is a complex number equation.
Note the the unit length part of R and C cancel out leaving Zo independent of length.
The variation in Zo with frequency is caused by the change in the capactive reactance with frequency.
The effect of changes in the dielectric or resistance with frequency will be to pull the Zo value away from what's calculated using Equation 3.
The L.F. Zo Phase Angle appears be -45 degrees. A real number (R) divided by an imaginary number (1/Xc) is always a negative imaginary number. The square root of a negative imaginary number will always have a phase angle of -45 degrees. So it looks like the L.F. Zo will have equal Real and Imaginary parts.
This has implications on how you terminate lines operating below the corner frequency.
This may also have implications for Loading Coils work. See 88 mH Loading Coils.
Corner Frequency
By equating the H.F. Zo and the L.F. Zo you can solve for the Corner Frequency:
Fc = R / ( 2 * PI * L) Equation 4Where Fc is the corner frequency in Hz and R and L are the same as in Equation 1
Transmission Line vs. Lumped Elements
If a transmission line is less the about 1/10 of a wavelength, it can be replaced with a lumped element equivalent circuit. For lines equal to or greater than 1/10 wavelength a lumped element equivalent circuit will not give the correct result.
Examples
Open Wire Phone Lines
The 1938 edition of Principles of Electricity lists in Table XII "Characteristics of Standard Types of Open Wire Telephone Circuits at 1000 Cycles per Second". The first line in the table is:
NON-Pole Pair Side, 165 mils wire gauge, 12 inch spacing, 4.11 Ohms per loop mile (plm), .00337 H plm, .00915 uF plm, .29 M.Mho plm, . . . 612 Ohms @ 5.35 deg Line Impedance (610 + 57j Ohms).
The Reference Data For Radio Engineers 1975 edition gives the equations for open wire line impedance as: Zo = 120 LN( 2*D/d) or 597 Ohms for this open wire line.
The corner frequency for this line (Eq 4) gives Fc = R / ( 2 * PI * L) = 194 Hz..
So the open wire line was a 600 Ohm line operating above it's corner frequency in the voice frequency range of 300 to 3,000 Hz.
So the matching impedance for open wire lines is theoretically different from that needed for twisted pairs.
CAT 5 Wire Measurements
To make the above practical some measurements were made on CAT 5 cable that was on hand. The box started out with a nominal 1,000 feet of 4 pair cable. The current length marking 20,010 - the start marking I put on the box of 19,755 = 255 feet have been already used leaving a nominal 745 feet in the box.
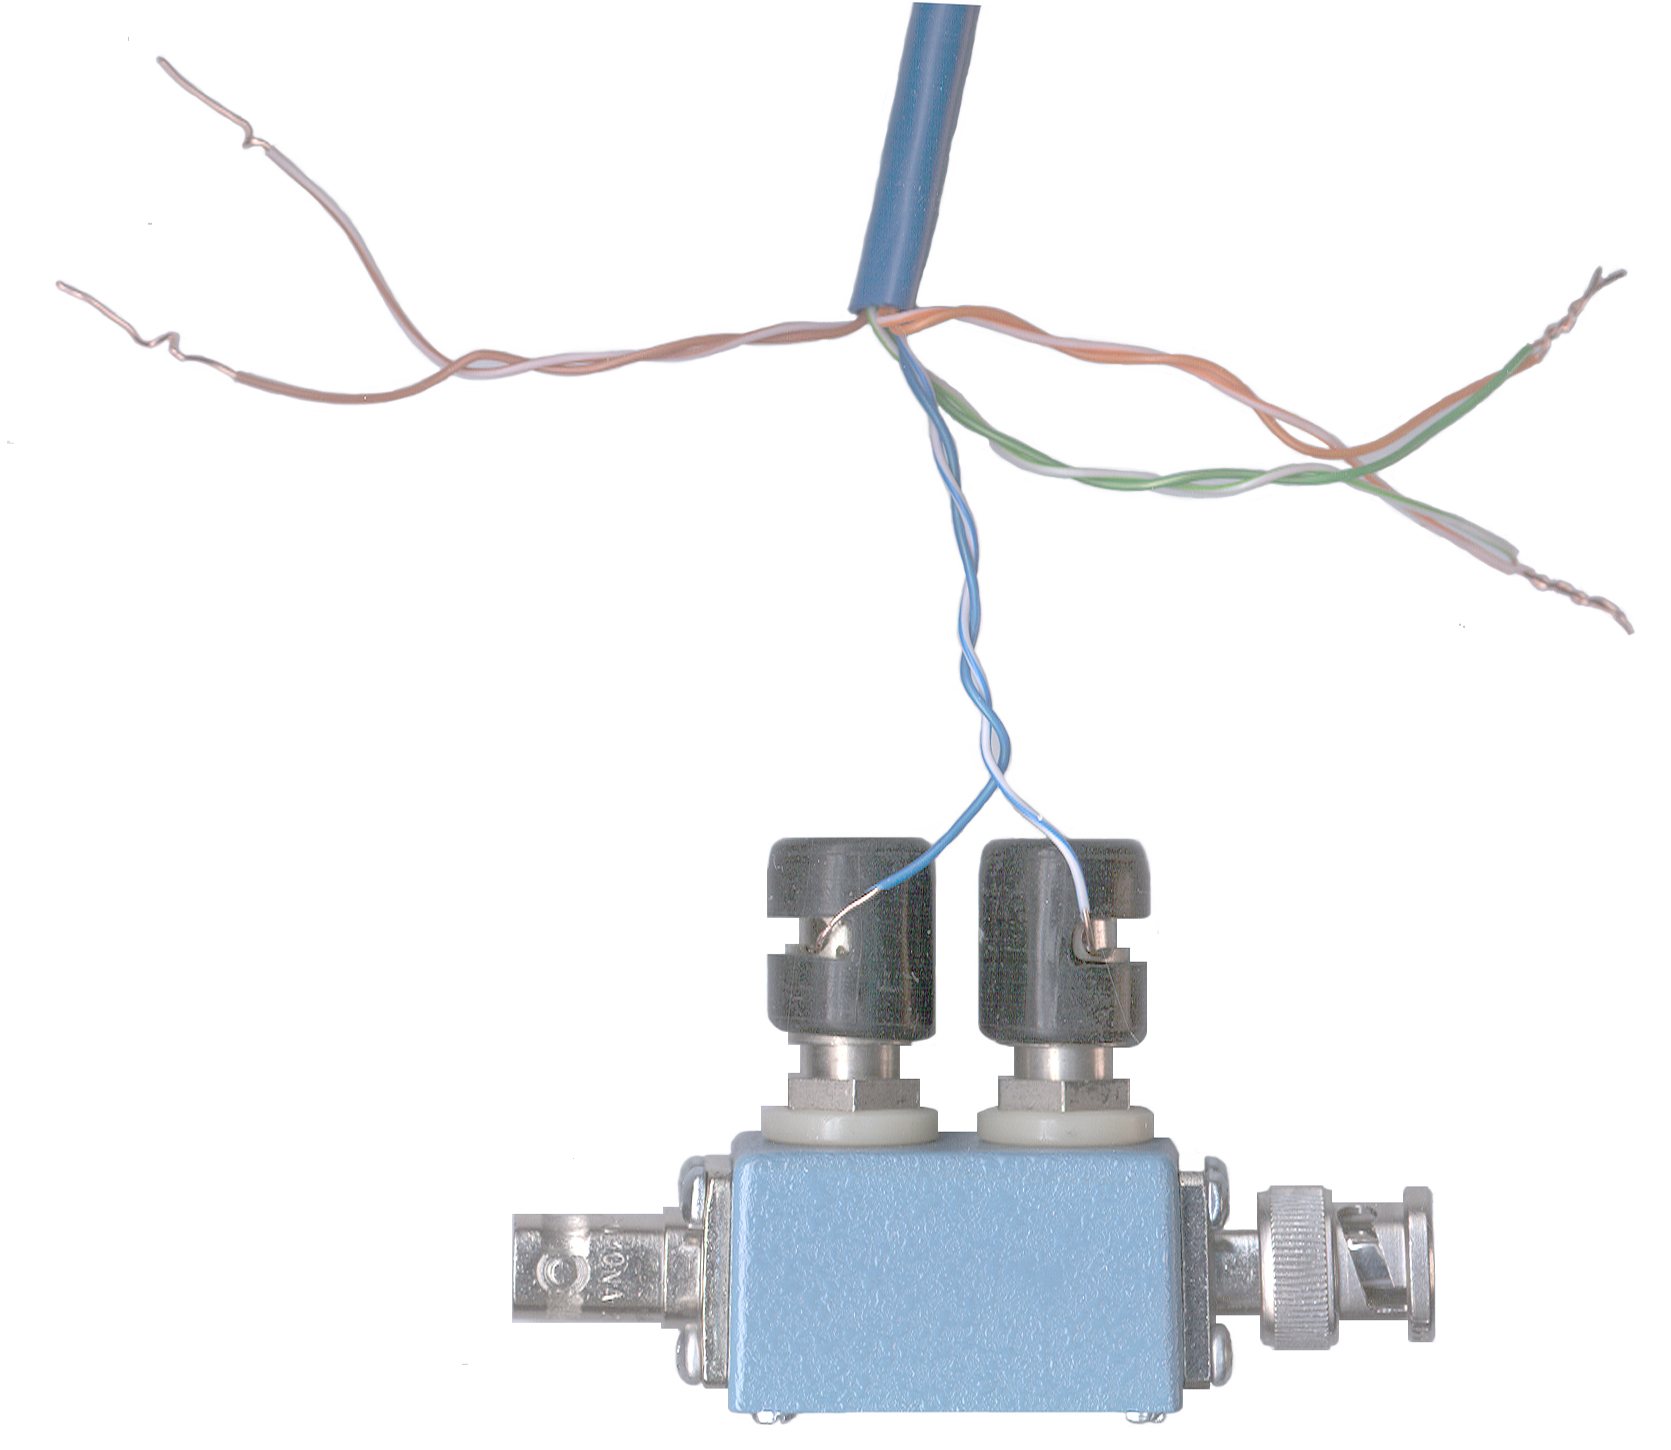
All the below measurements are made with all four CAT 5 pairs connected in series, about 3,119 feet end to end. At the far end of the cable the green and brown pair are joined and the blue and orange pair are joined. At the near, end shown in the photo, the orange and green pairs are joined. Testing is done on the blue pair and the brown pair is either opened or shorted for the tests.
Twist
Some have asked about the twist of various cables. The Phone Company has been using twisted pairs for a very long time. They discovered that if the twist of all the pairs in a cable have a slightly different twist the cross talk is reduced compared to a cable made up with all pairs using the same twist. It costs a little more to make the different twists, but the performance improvement must be worth the extra cost.
Note that the twist does not effect the impedance of the line, it's just a way to reduce the cross talk.
Some measurements on the CAT 5 LAN cable I'm using here shows:
Green 0.604" per turn or about 20 turns per foot
Blue0.608"0.545" per turn or about 22 turns per foot
Orange 0.701" per turn or about 17 turns per foot
Red (brown) 0.762" per turn or about 16 turns per foot
Measurements made with mechanical calipers
The solid copper wires are very close to 0.020" diameter, or 24 AWG. The wire tables show 38.96 Feet per Ohm.
Measurements made with a DMM
After connecting all 4 pair in series and shorting the far end the loop measures 160.12 Ohms on a Fluke 87 DMM so the computed total wire length is 6,238.275 feet, or divided by 2 gives 3,119.137 feet one way, which divided by 4 pair gives 779 feet, close to the 745 feet found using the wire numbers.
Measurements made with the HP 4332 LCR meter give:
Short: R = 160 Ohms, L = 500 uH
Open: no resistance reading, C = 42 nF
Calculating the high frequency impedance using Equation 2 gives Zo = 109 Ohms which I think is very close to what CAT 5 cable should be.
Summery of the cable parameters
All of these parameters are constant with frequency. The changes in the impedance plots come about because the impedance of a capacitor and inductor are a direct function of frequency.
For use in the above equations:
R = 51.335 Ohms / 1,000 feet
L = 160 uH / 1,000 ft
C = 13.465 nF / 1,000 ft
G = 0 (shunt R = infinity)
H.F. Zo = 109 Ohms
Fc = 51 kHz
Testing the values for the H.F. Zo case:
2*PI*F*L compared to R at 1 MHz -> 502 >> 51, so between 51 kHz and 1 Mhz is in the transition region between the L.F. Zo and the H.F. Zo.
Measurements made with the HP 4395A Network Analyzer
Z:Trans technique
In the Z:Trans mode the 4395A displays the impedance of a device connected in series with the center conductor. No test set is needed and no special firmware, it can be done with a stock basic 4395A.
When using Z:Trans you can NOT use a power splitter and A/R type measurements.
This is probably because the Z:Trans method requires a true 50 Ohm Source and 50 Ohm load. But when a splitter is used to feed the R channel the actual source impedance is not 50 Ohms.The source needs to directly drive the A ( or R or B) channel.
Note the small Pomona box can be used on a scope to provide two wire input terminals.
Calibration
First with the source connected to a receiver a response calibration is performed.
Measurement
Then the near end of the pair is connected from the source center conductor to the receiver center conductor. The source and receiver shields are connected together. These connections are made using a simple test fixture consisting of ITT Pomona metal box Model No. 3752 that comes with a Male and Female BNC connector and I added a couple of phone type spring clip binding posts. This is a network analyzer "insertable device", since no adapters are needed to insert it into a transmission path. The Z:Trans fixture has about 57 pF of capacitance. About 3 orders of magnitude smaller than the capacitance of the pair being measured.
4395A Hints & Tips
To activate Z:Trans -> In the Measurement area, press Meas, then the softkey "CONVERSION {OFF}, in the new menu press "Z:Trans"
To get a log frequency sweep: -> In the Sweep area press "Sweep" then the "Sweep Type" softkey, then "LOG FREQ".
To get a color graphics dump: -> In the Instrument state area press copy, then the "PRINT SETUP" softkey, then "COLOR". This will change the graphics dump to color. I'm still trying to remember how to change the color palette. To fix the colors I'm now editing the graphics screen dumps and also erasing the softkey labels from the dump. These plots came from the Instrument State, save, graphics, not from an Instrument State, Copy, Print operation. The output to floppy disk is a *.tiff file.
Note that the IF bandwidth needs to be about 10 times smaller than the lowest frequency, so to keep the sweep times somewhat reasonable I have set 100 Hz as the start freq. and 10 Hz as the BW.
When measuring long lengths of coax using the Z Transform method, connect the shield to the source to prevent noise pickup.
Impedance Plots
Short is the red line and open the blue line.
This plot shows the |Z| on a linear Ohms scale. You can see that at low frequencies the value of Z is about 160 Ohms, the same as the DC resistance read on a DMM.
The marker is on the lowest frequency point where the open and short values are the same at 18.3 kHz where the impedance of the short is the same as the open and is 183 ohms. This crossing of the open and short plots is below the corner frequency of 51 kHz and you can see that the Zo of the line (183 Ohms) is already higher than it's H.F. value of 110 Ohms. With a longer length of line there would be more crossovers below 51 kHz so you would see the Zo values. Tomorrow I'll see if anyone downtown has a box of CAT 5.
At 500 kHz the impedance is near 110 Ohms.
The Corner Frequency of 51 kHz is about where the lowest frequency dip shows on the blue (open) trace. Or the lowest frequency max on the red (short) trace.
The Blue trace is Open and the Red trace is the short.
Since the Frequency and |Z| are both on log scales you can see the slope of the impedance below the corner frequency here (parallel to the violet line).
The marker at 18.3 kHz is reading 45.257 dB which can be converted back into Ohms using:
Ohms = 10 ^ (dB/20) Equation 5
or = 183 Ohms the same as the marker in the linear plot above.
In Equation 3 the top term "R" corresponds to the constant R (red) trace and the other term "1/(2*PI*C)" corresponds to the sloping (blue) trace.
The left end of the violet straight line is at 88 dB (25 k Ohms) @ 100 Hz. The right end of the straight violet line is at 48 dB (250 Ohms) @ 10 kHz. So the |Z| differs by 2 decades (100 x) and the frequency differs by 2 decades. This line is parallel to the capactive reactance, but to get Zo you need to divide the capactive reactance into R (160 Ohms) and then take the square root. The square root function changes the slope of Zo to one decade of of |Z| for 2 decades of Frequency.
The Belden paper (see Links below) is correct about the Zo vs. frequency slope.
Doing the complex math using Equation 3 and the summary wire data gives Zo = 551 - 551j
The phase angle is -45 degrees in the result. The vector magnitude is root(2) times 551 or 779 Ohms.
Plot showing the phase. The Red trace is the short, 0 degrees at low frequencies and the blue trace is the open, -90 degrees at low frequencies.
Ripples in Magnitude and Phase Plots
The phase ripples are just transmission line ripples and their spacing along the frequency axis is given by:
The phase has changed 90 degrees at about 57. 14 kHz (very near the corner frequency).Putting math to the magnitude of the phase and magnitude plots probably will require sleeping on it.
If 57.14 kHz corresponds to a 360 degree phase change at a wavelength of 5, 250 meters, then a 90 degree phase change at 57.14 kHz corresponds to a wavelength of 1,312 meters or 4,306 feet.
If the velocity of propagation along the pair was 72% of the free space propagation then 3, 119 mechanical feet would be equivalent to 4, 206 electrical feet.
If the line was lossless then the ripples would go from zero to infinite Ohms. Because of the loss (resistance) the magnitude of the ripples gets smaller and smaller with each increase in length measured in wavelengths. And the ripples have almost died out at 500 kHz.
Computed Complex Impedance
By reading the markers on the linear magnitude and phase plots I have taken a number of points and computed the complex Zo value for a handful of frequencies. More on this when I find a clean way to post the data. It's currently an Excel spread sheet with a lot of "IM" type worksheet functions and I can't figure out how to control the format of a COMPLEX type. Although I can get normal numbers to show with no decimal places the complex numbers show a whole lot of digits. How to make them more reasonable?
Z0 = SQRT( Zopen * Zshort) Equation 6
Where Zo, Zopen and Zshort are complex vector quantities, or|Zo| = SQRT( |Zopen| * |Zshort| ) and phase of Zo = (open_phase + short_phase)/\ 2 in degrees. Equation 7
Note that the phase of Zo for the L.F. range will be the short phase ( 0 deg) plus the open (capactive) phase (-90 deg) divided by 2 or -45 degrees.
Doing the complex math on the 1 kHz 4395A measured mag and phase data using Equation 6 gives the actual impedance as:
Zo (1 kHz) = 539 - 522j = 751 @ -45.9 degrees.
Impedance with some Loads
The following plots were made using the same 3119 feet of CAT 5 cable by terminating the far end with a resistor. Note that if the electrical length of the cable is 4, 306 feet then the lowest ripple frequency is very close to the L.F. corner frequency. To really see transmission line effects in the L.F. region the length needs to be longer. With a longer test pair the ripples would be in the voice frequency range where the Zo is much higher than the H.F. Zo.
Note that for applications, like microphone cords, that are much shorter than 1/10 wavelength, the Zo of the line is not an issue since the line can be treated as lumped elements.
With a 462 Ohm (nominal 470) load at the far end makes the input to the line look like 600 Ohms flat from DC to 2 kHz..
At DC you see the 160 Ohms of line resistance in series with the 462 Ohm load resistor, or 622 Ohms DC resistance. As the frequency goes up the capacitance of the cable starts shunting the resistance.
The phase from DC to about 2 kHz is not far from 0, so the 600 Ohm impedance is approximately real. With 462 Ohm resistor at the far end.
Impedance with a Coil
The coil used for these tests was made for use as a loopstick antenna for the WWVB time station at 60 kHz. It had no resonances in the 100 Hz to 500 kHz range being tested here. It's way below the inductance of a common loading coil (88 mH), but does have enough inductance to see the effect of adding series inductance.
The far end shorted is the Blue trace and the open line is the Green trace.
A 4.8 mH coil connected between the 4395A and the line.
The reference level is set at the magnitude of the lowest frequency (45.706 kHz) where the short and open impedance are the same magnitude (281 Ohms) very close to 10 kHz.
The peak just below 500 kHz is the self resonance of the 4.8 mH coil.
The minimum (117 Ohms) at about 10.9 kHz is due to the resonance between the 4.84 mH coil and the lumped capacity of the 3,119 feet of cable.
The far end shorted is the Blue trace which starts out at zero phase 100 Hz and climbs up to 28 degrees by 3 kHz and 60 degrees by 10 kHz.
The open is the Green trace which starts out at -90 degrees at 100 Hz and stays below -80 degrees till 6 kHz. It's about -40 deg at 10 kHz.
RG-58/U 50 Ohm Coax
The marking says "Tandy Wire & Cable E111378A Type RG/58U 20 AWG CL2 75ºC (UL)". There also appear to be marks every foot, but no foot counter. Length is about 15 turns each about 14" diameter or about 50 feet.This 50 foot long coax is not long enough to see the crossovers at and below the corner frequency. But you can see the short impedance lifting up from the pure resistive value at the corner frequency caused by the inductance becoming significant.
Measurements
Conductor diameter = 0.029" -> 21 AWG (not the # 20 that's on the label) 78.32 feet per Ohm.
The Fluke 87 DMM using the high precision mode (power up holding down yellow button) and the delta mode shows 0.58 Ohms for the center conductor to center conductor resistance, or 45.425 feet.
Using the 4395A with a coupler and measuring the time delay to a short shows about 170 ns or 167 electrical feet out and back, or 83 feet one way, which is 52 feet mechanical if the velocity factor is 0.623.
The HP 4332 shows 1.6 nF with the cable open and 6 mH for a shorted cable.
The Z Transform measurement of the imaginary part of the cable impedance (open circuit) at 1 Mhz is 81.725 Ohms, or the cable has a capacitance of 1.95 nF. A shorted cable is 40.28 Ohms imaginary or 6.41 uH.
The H.F. Zo = SQRT( 6.41 uH / 1.95 nF) = 57 Ohms. from Equation 2
The resistance looking into one end of a shorted cable is 1.48 Ohms.
In the plot below the marker at 10 kHz is showing 3.3283 dB -> 1.4 Ohms
The Zo corner frequency is = 36.7 kHz
On the phase plot for the short the angle at 10 kHz is about 5 degrees, increasing to 31 degrees at the corner frequency (36.7 kHz), and to 85 degrees at 1 MHz.
The phase of the open stays near -90 up to 1 MHz, then bounced back and forth between -90 and +90 as the line electrical length goes through 1/4 wave lengths.
500 Dial Phone Line Impedance
Bias-T Fixture for Z:Trans method
The impedance of a Bell System 500 dial phone depends on the line current through the phone. This is used to control the loss compensation so that a phone near the central office will be about as loud as one that's far from the CO.
To make this measurement a dual bias-T" fixture was built. This is required for the Z Transformation measurement method since the DUT is inserted in line with the center conductor and the 4395A does NOT want to see any DC on either the source or receiver ports.
Inductors
Two filament transformer primary windings (Radio Shack 12.6V @ 400 ma transformer RS 273-1365A).
DC resistance 152 Ohms for each transformer.
Imaginary impedance at 1 kHz = 18.198 k Ohms, L = 28.6 Henries for the two inductors in parallel.
Capacitors
15 each 2.2 uF @ 250 Volt Mylar caps in each Bias-T (Jameco 93999CD)
Imaginary impedance at 1 kHz is -9.13 Ohms, C = 17.4 uF for the two blocking caps in series.
LEDs
Two anti parallel LEDs are installed on each of the BNC(f) connectors between the center conductors and ground. These are the connectors that go to the 4395A source and receiver. When the phone has current if the dial is operated or the hook switch all of the LEds flash indicating that there is voltage present at the connectors.
To make a plot the fixture is disconnected from the 4395A, the power supply turned on and the current set, all with the 500 phone off hook. Then the fixture is connected to the 4395A and the plots saved to disk This way no voltage spikes are sent into the analyzer.

Line Polarity
With the black bell wire connected to the "G" network terminal the phone was polarity sensitive. But with the black bell wire connected to "L1" either polarity works OK.The open fixture by itself is over 20 k Ohms at 1 kHz and about 15 Ohms at 1 kHz with a short, both values well away from the phone data.
The phone phase by itself is slightly positive in the voice frequency range.
When the phone is connected to the end of a 3,119 foot twisted pair line the impedance at 1 kHz for the combination is about 1.3 k Ohms at 40 ma line current and 2.4 k Ohms at 10 ma.
The phase for the combination is zero degrees at 2 kHz. So the phone is conjugate matching the line.
The phone by itself is 1,000 + 500j Ohms at 2 kHz.
Patent
Links
Characteristic Impedance of Cables at High and Low Frequencies by Belden
Agilent Impedance Measurement handbook 2nd Edition (5950-3000) - Section 5-8 Cable Measurements has equations and a plot of 50 Ohm coax showing the low frequency impedance and the -45 degree phase angle of same.
Back to Brooke's PRC68,
Products for Sale, Impedance, Telegraph,
Telephone, Electronics, Military
Information, Personal Home page
page created 19 Sep. 2003.