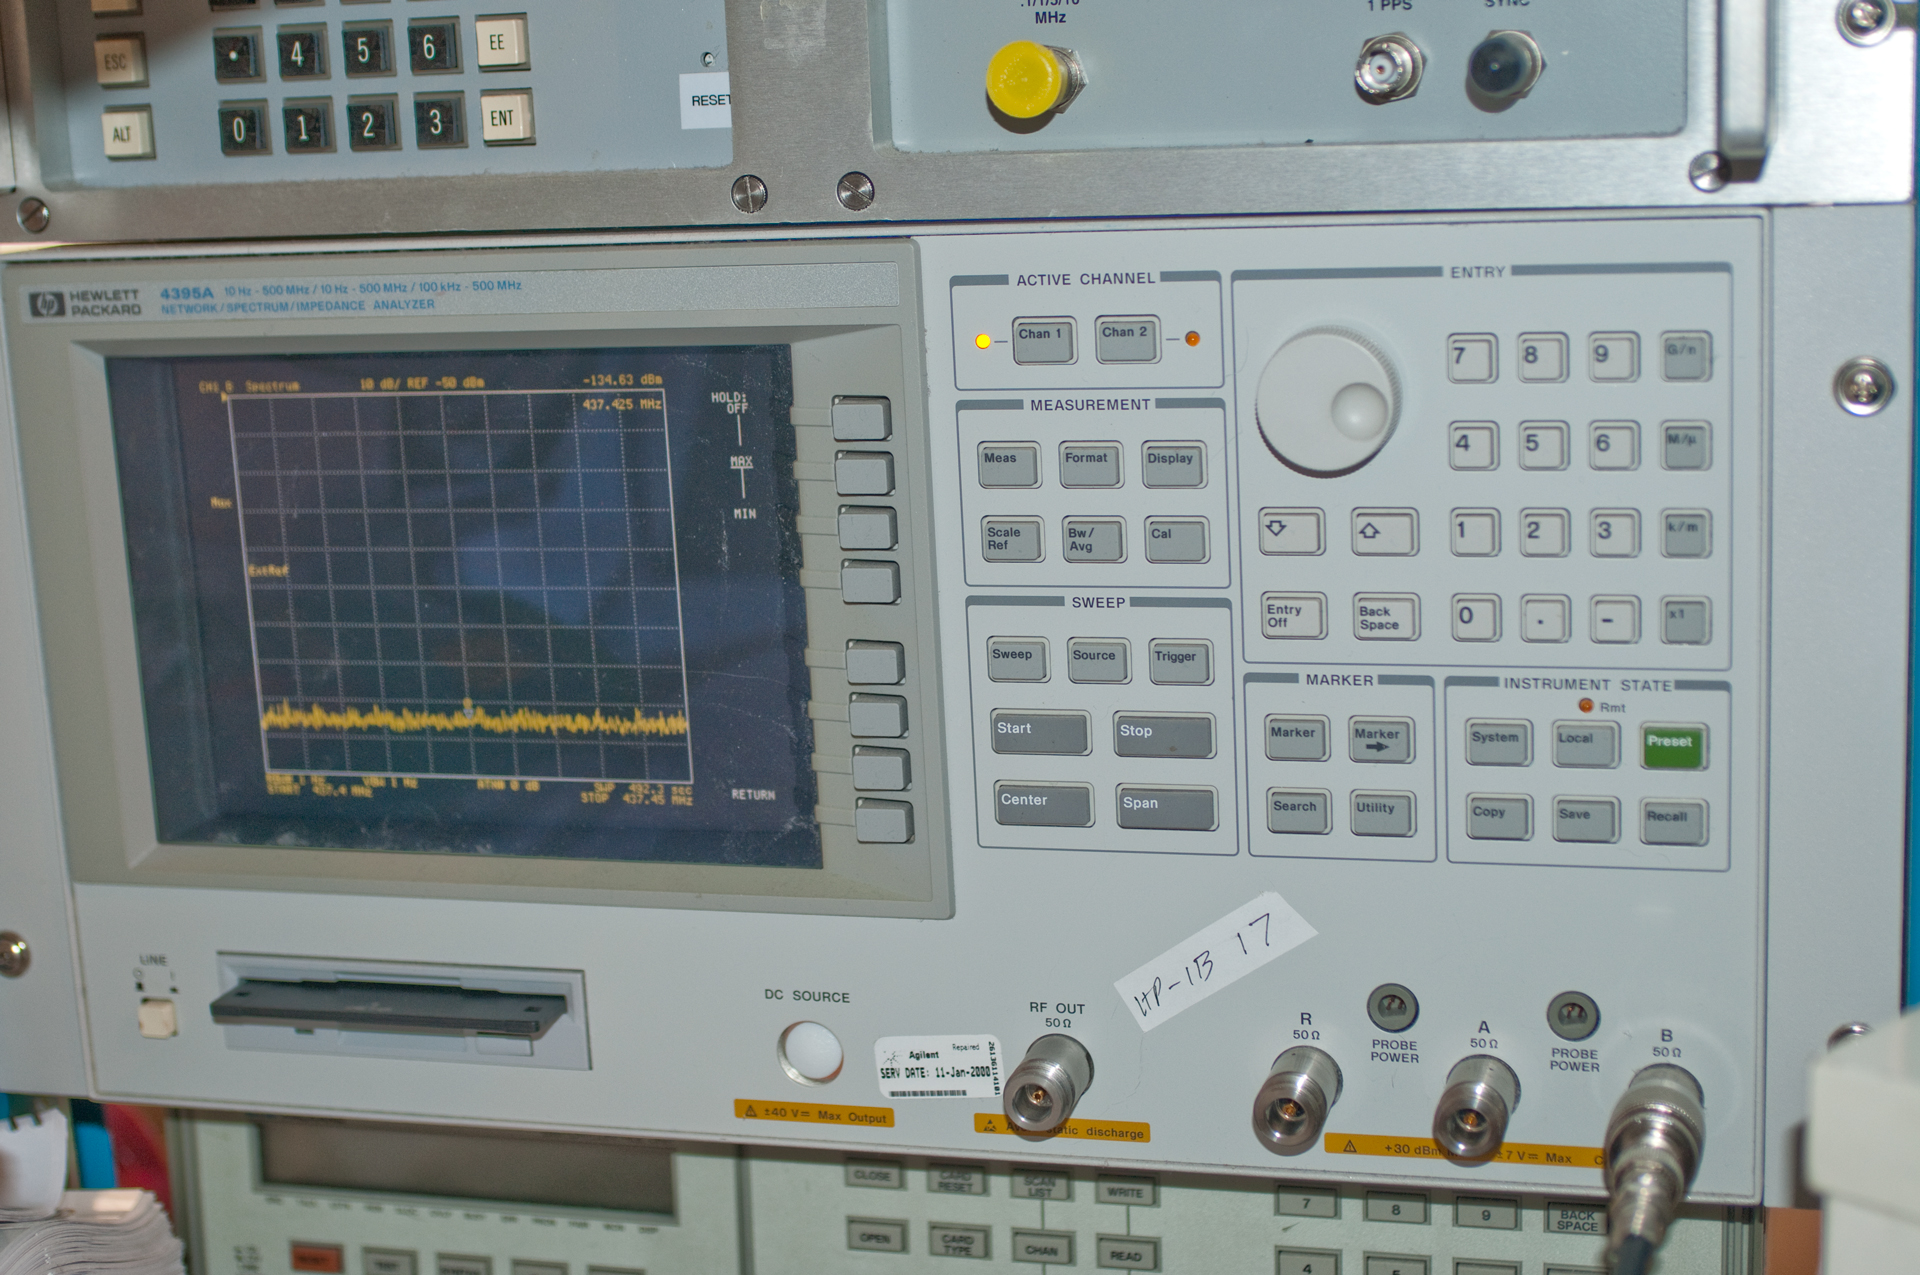
HP 4395A Combination
Network, Spectrum, Impedance Analyzer
© Brooke Clarke,
N6GCE 2001 - 2023
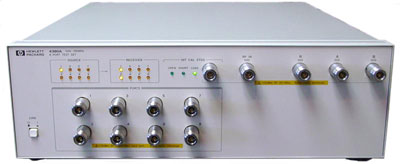
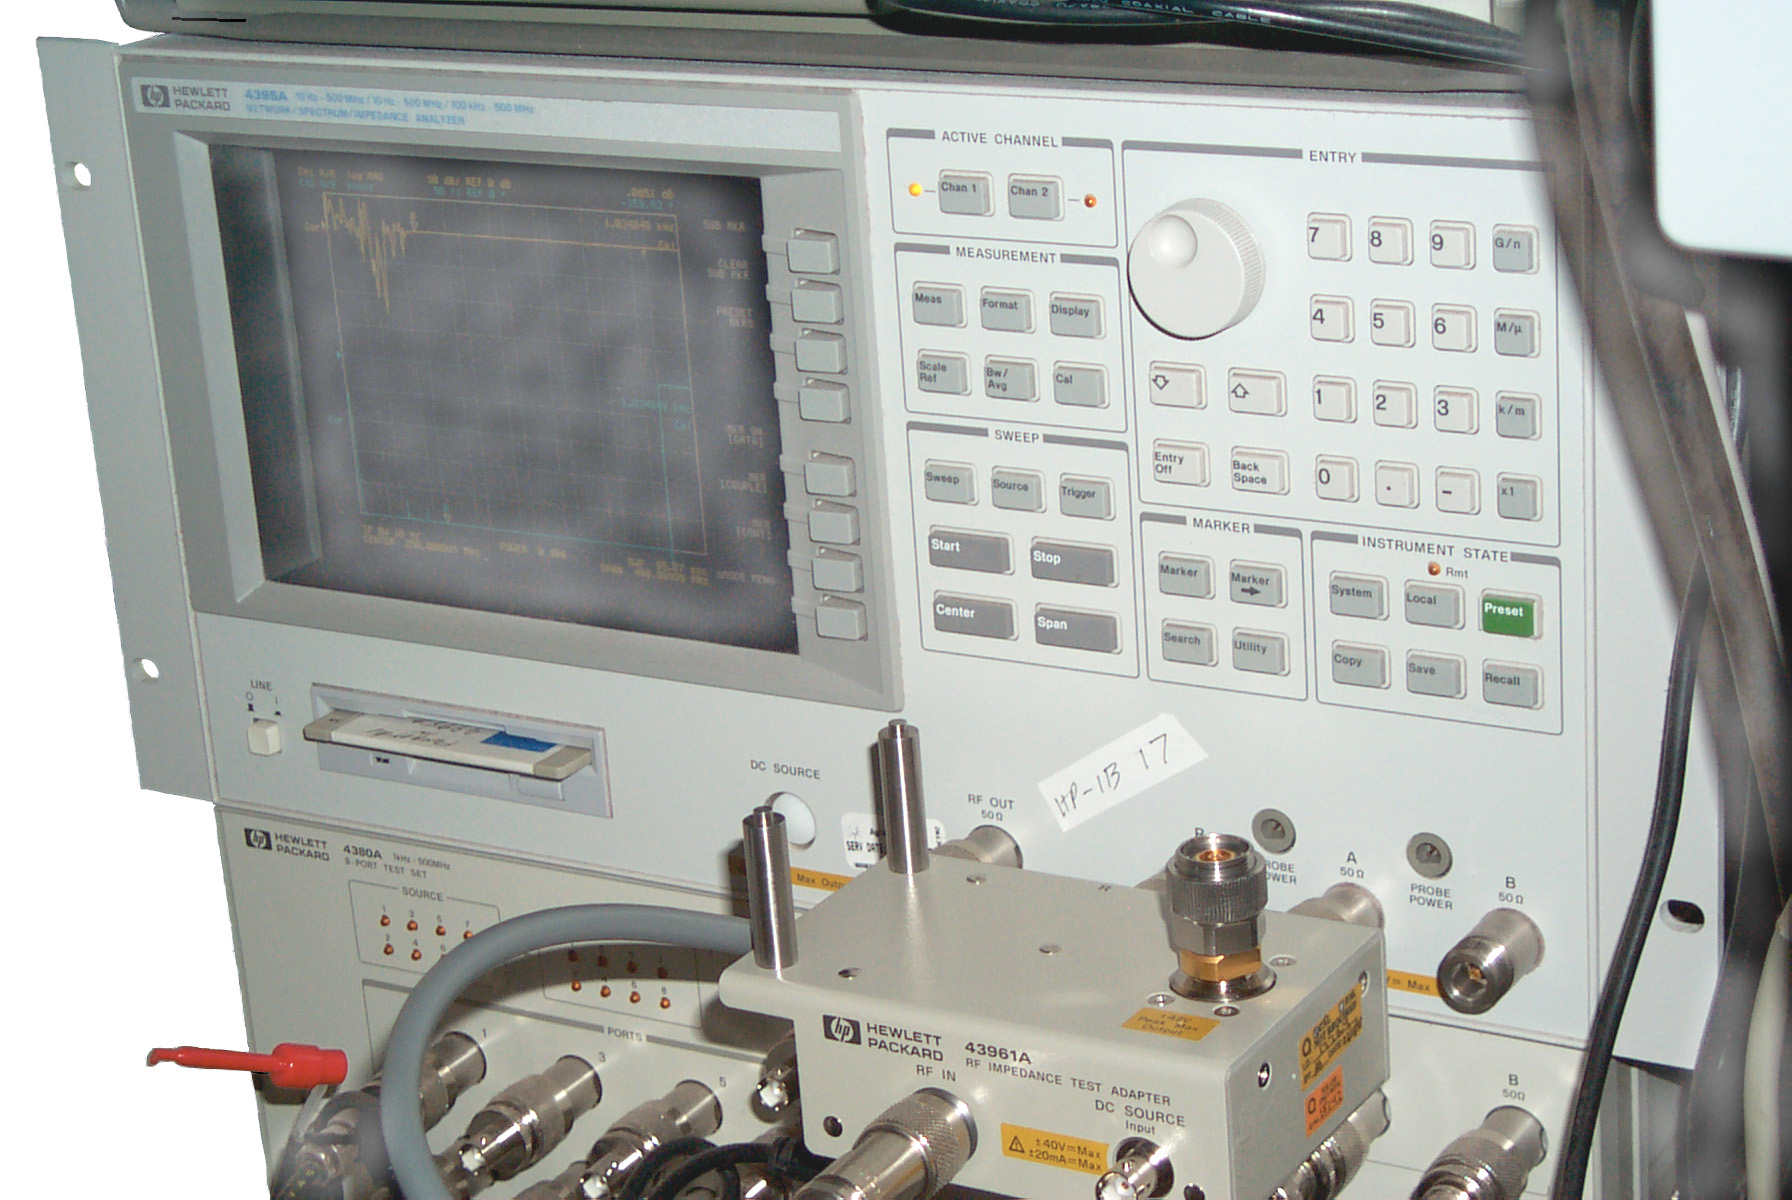
4395A sitting on 4380A 8 port test set with 43961A Impedance
V/I test set connected to Source, A and B ports.
Introduction
All of the IF signal processing is done by a DSP chip
instead of using log amplifiers and analog filters as is done in
older analog instruments. This results in far superior
performance than analog type boxes, especially in Spectrum
Analyzer mode. This is the replacement for the 4195
combination instrument and is newer than the 4396B which covers
100 kHz to 1.8 GHz box. The 4395A covers 10 Hz to 500 MHz.
To get an feel for what the DSP method offers consider that an
analog type spectrum analyzer takes 30 seconds to sweep a 100 KHz
band using a 100 Hz resolution bandwidth. The 4395A
will make the same sweep in 0.3 seconds, i.e. 100 times
faster. The RBW filter widths offered on analog spectrum
analyzers are much wider than the 1 Hz RBW offered on the
4395A. This when combined with true I&Q detection allows
measuring the true RMS value (an analog SA typically measures peak
values) thus noise measurements can be displayed directly in /root
hertz.
Spectrum Analyzer
10 Hz to 500 Mhz frequency range with a linear or log
sweep.
If you have just the 4395A box you have a fully functional
spectrum analyzer. There is a hardware option 1D6 for time gating that will synchronize the
sample time to an external pulse that's typically used for
measuring things that rotate, like disk drives (E5022A).
The minimum RBW is 1 Hz. This allows seeing very weak
signals. The narrowest IF bandwidth communications
receiver I have is the NRD 545 with
a DSP IF bandwidth of 10 Hz. The 4395A has ten times lower
bandwidth. But the 4395A does not have any IF outputs.
Note that there is a way to display noise like signals as "per
root Hz" and when this is done the display shows the units as
/Hz because there is not character for SQRT. In the
Detection type select "sample" instead of positive or negative
peak. In this mode the DSP is computing SQRT(I*I + Q*Q),
i.e. the actual power, unlike older analog spectrum analyzers
that used peak detection.
The sweep speed is limited by the lowest displayed
frequency. When measuring audio frequencies the sweep
needs to be slowed way down to get valid readings.
Input Adapter
To allow the audio output from a Squad Radio
to be connected to the input of the spectrum analyzer an adapter
is required to both block the DC signal (up to 6.x Volts DC is on
top of the 1/2 Watt max audio signal to sense the connection of an
external speaker and mute the internal speaker.) and attenuate the
AC signal. To do this and have a reasonably low cutoff
frequency I used the following circuit:
Starting from the Spectrum analyzer BNC(m) connector on a Pomona model 2391
box that comes with BNC connectors already installed:
a 22 Ohm resistor to node 1
a 33 Ohm resistor from node 1 to ground
a 470 Ohm resistor from node 1 to node 2
the ground side of a 150 uF cap from node 2 to node 3
a 470 Ohm resistor from node 3 to node 4
a 33 Ohm resistor from node 4 to ground
a 22 Ohm resistor from node 4 to the center pin of the BNC(f)
connector on the radio side of the adapter.
A Network analyzer response test shows the attenuation to be
within a couple of tenths of a dB up to many tens of Mhz.
At the low frequency end at 21 Hz the response is low by 0.89
dB. At 150 Hz the response is 0.1 dB low. This adapter has
40.0 dB flat attenuation over the useful audio spectrum.
That's not a problem since the 4395 has a huge dynamic range so
loosing 40 dB is not an issue.
Spectrum Monitoring
Because of the 1 Hz RBW capability of the DSP filter it's possible
to see very small signals, although it takes time to sweep wide
bandwidths. There is no IF output like on analog spectrum
analyzers. You can not connect an external demodulator.
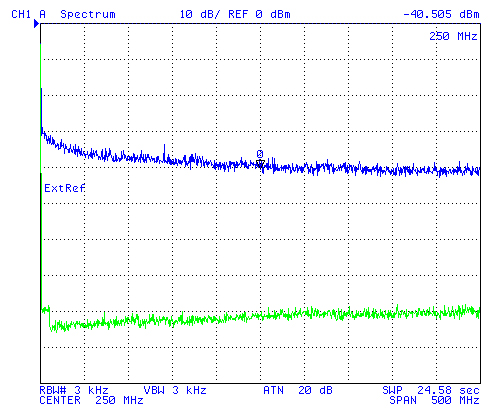
By using the DISPLAY/DATA HOLD MAX function, the trace
remembers the peaks to provide a visual record of all
transmissions. Example plot scan 30 to 90 MHz, 3 kHz RBW
overnight. 3090A.TIF
118 - 136 MHz AM air band, used
multiple passes of sub markers to get all the frequencies
Spectrum Plots
0 to 200 kHz
200 to 400 kHz
118 to 136 MHz
136 to 138 MHz
150 to 154 MHz
153 to 157 MHz
Spectrum around WWVB 60 kHz - description
of watching the 10 dB time code amplitude modulation
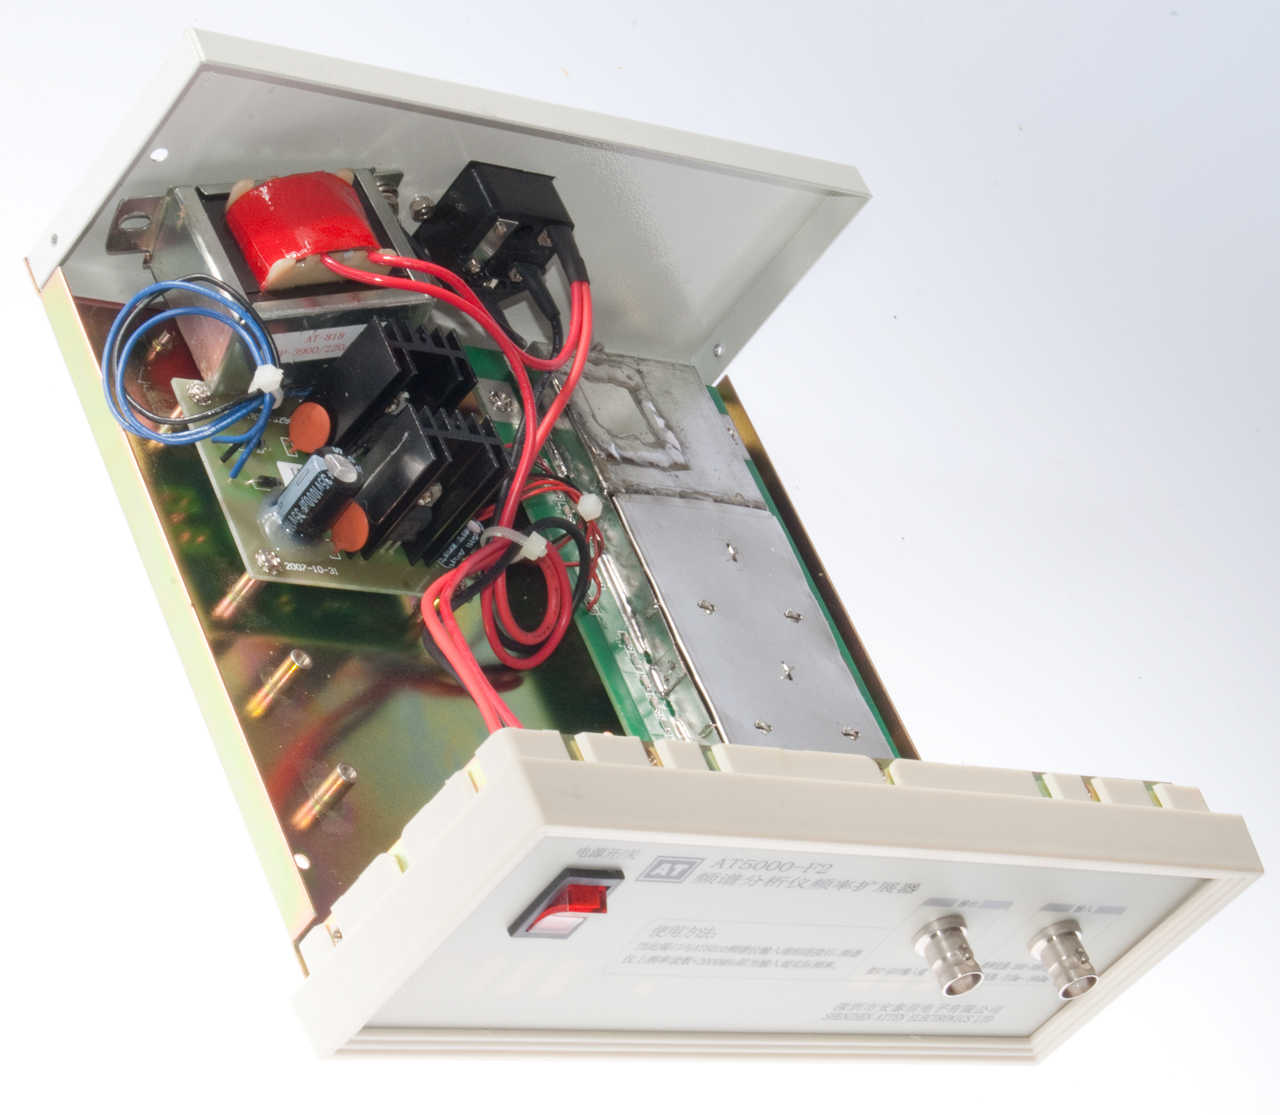
Frequency Converter

Got this from eBay with title: F2 2GHz Spectrum Analyzer Frequency
Expander for AT5011
The Make & model number: Shenzhen Atten Electronics Ltd.
AT5000-F2
Input: 2050 - 3050 MHz @ -27 -to -100 dBm.
Output: 0 to 1000 MHz
The problems are:
- that they left out one of the transformer mounting
screws, see photo above. The unit came in a sealed
plastic bag and there was no screw there. I think the
screw fell out before the unit was bagged.
- The transformer is for 220 VAC, not 120VAC.
Will be changing the transformer once the output specs are
determined. (nominal output voltage and current capacity).
The power supply board is fed with 3 wires from the transformer
and feeds three wires to the RF converter.
There are a couple of 3-terminal regulator ICs:
I'm guessing that the transformer output is a single winding with
a center tap. It feeds a couple of rectifier diodes and a
filter cap. That feeds both of the ICs, one for +12 and one
for +5V.
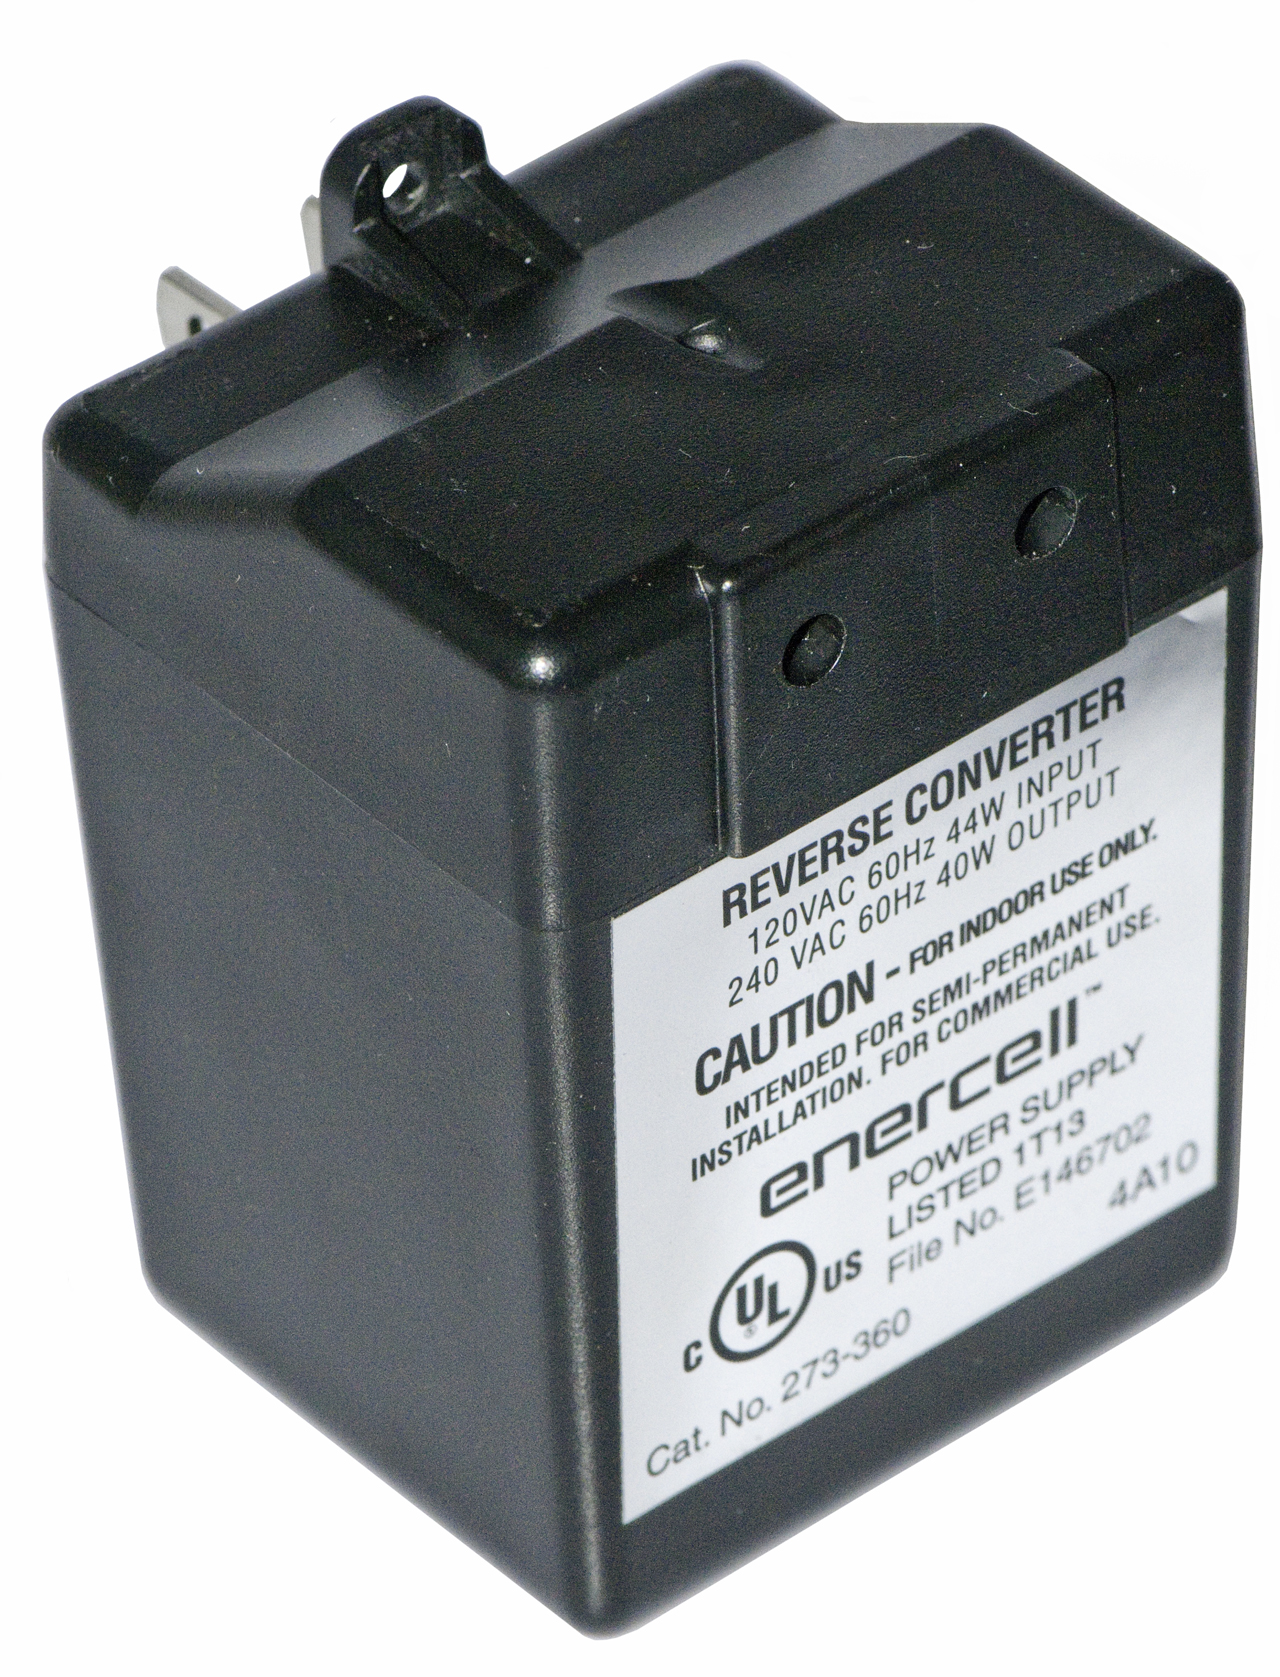
Reverse Converter
120 VAC input <= 44 Watts
240 VAC output <= 40 Watts
Enercell
Radio Shack 273-380
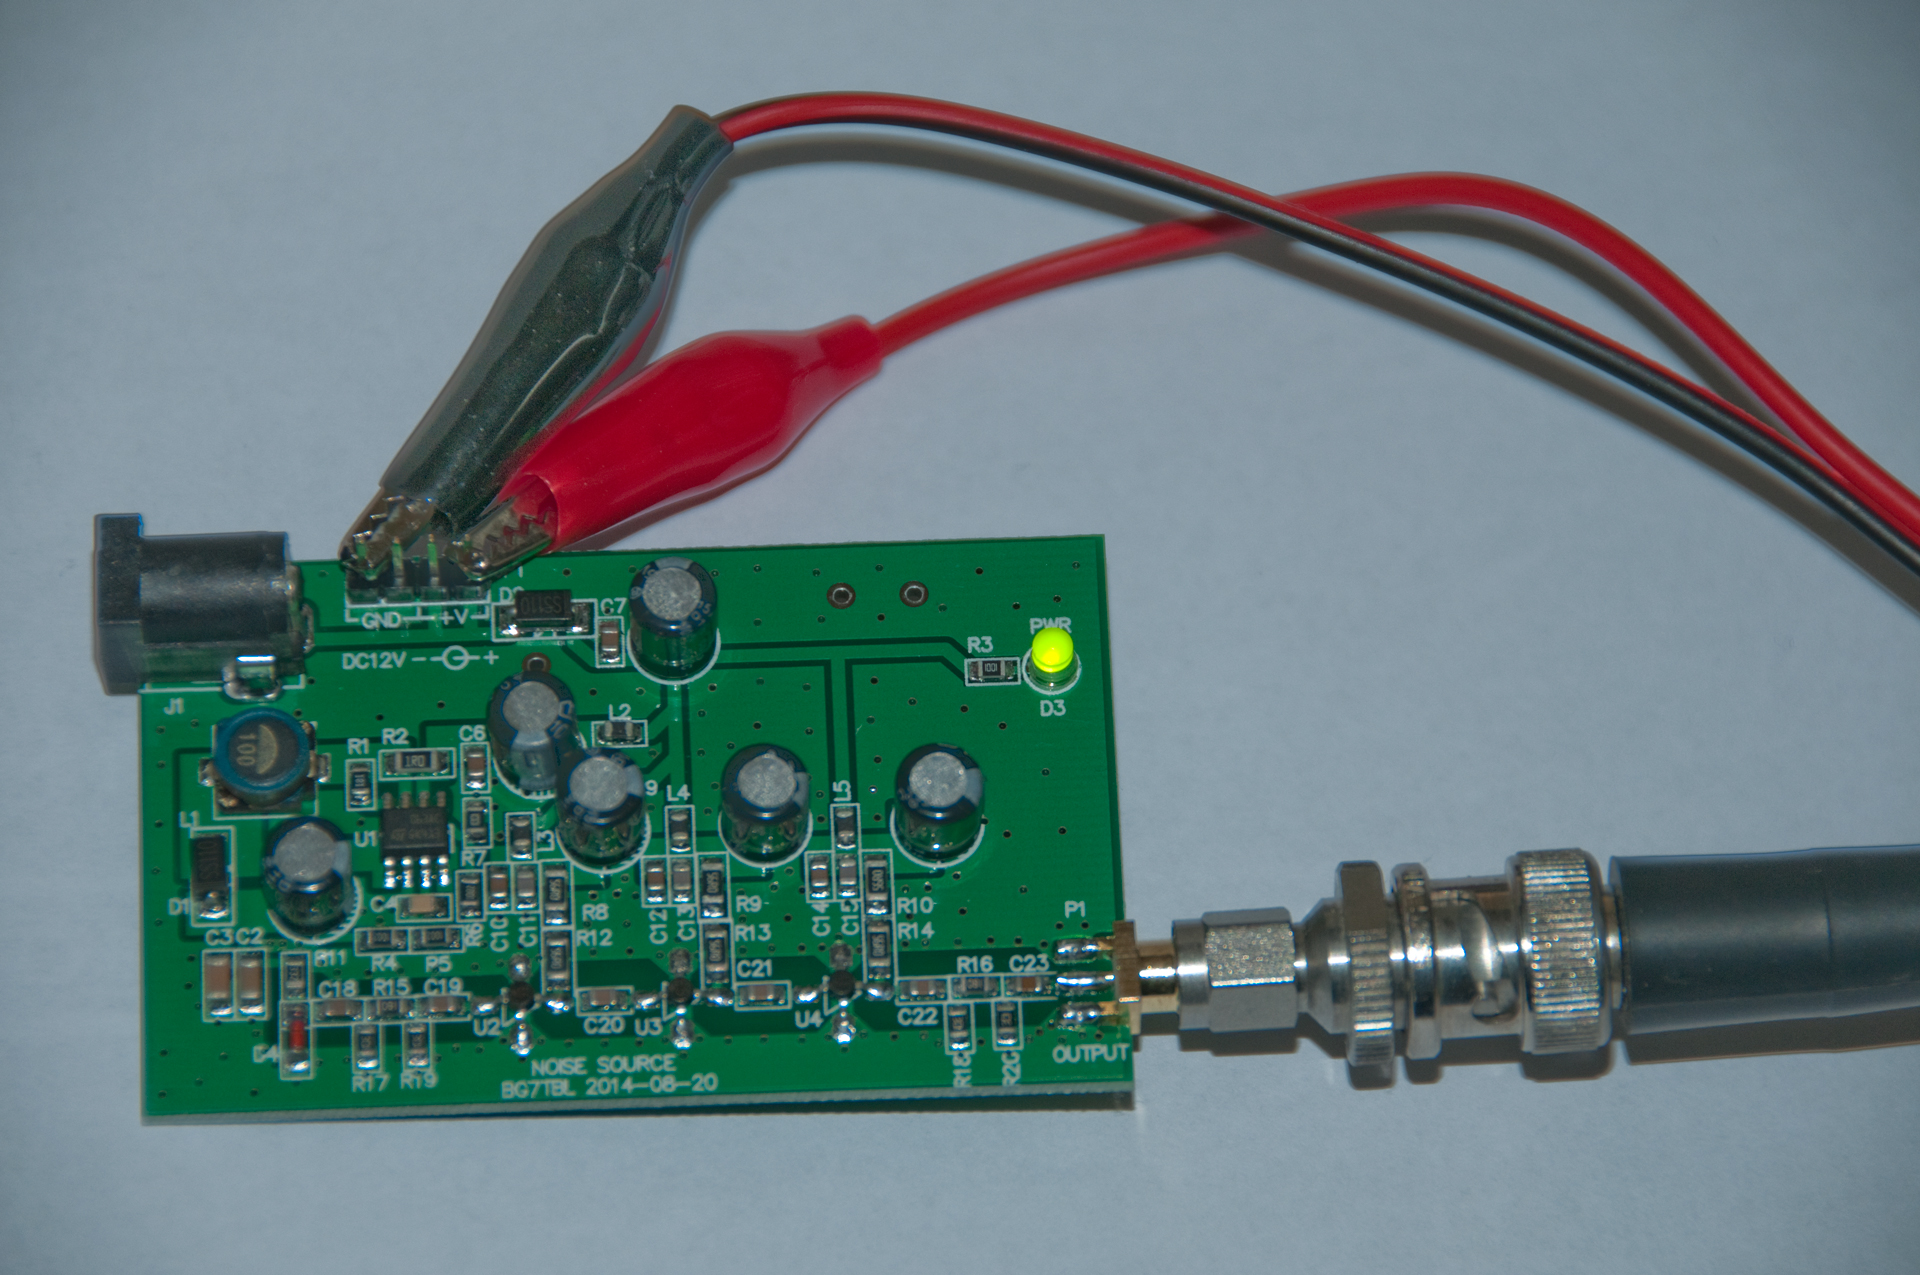
Noise Source
Got this on eBay with title "noise source/Simple spectrum external
tracking source" by seller fly-xy.
claimed performance is about the same as actual.
ENR (similar to the output signal strength) : 50KHZ-1.5 GHz,
better than 50DB;1.5 G-2G is superior to 40DB, 2G-2.6G is better
than that of 30DB.
Network Analyzer
10 Hz to 500 Mhz frequency range with a linear or log
sweep.
With just the 4395A there is very limited Network Analyzer
functionality. You can do a simple through type calibration
that corrects for amplitude variations but does not do vector
error corrections.
Test Sets
To get really useful results it helps to have some type of test
set. There are a number of options:
- 87512A is a 50 Ohm passive DC to 2 GHz Transmission -
Reflection box that will give you S11 and S21 at the same
time, but you need to remove and reverse a device to get it's
S22 and S12 parameters. If only the S11 and/or S21 is
required or if you need S-Parameters below 300 kHz this is the
one to use. The 87512B is a 75 Ohm version. These
come in a carry case with a short and 50 Ohm termination for
doing the calibration.
- 85046A
is a 50 Ohm rack width 300 kHz to 3 GHz S-Parameter Test Set
that interfaces to the test set control DB25(f) connector on
the back of the 4395. It uses relays to switch from
forward to reverse87512 measurements and can measure all 4
S-Parameters without disturbing the device under test. The
85046B is the 75 Ohm version. You will need a
calibration kit and cables & adapters for you device under
test.
K6JCA - Modifying
a 75 ohm HP 85046B S-Parameter Test Set to be 50 ohms
(2015 - the eBay price of the 8503A + 85046B is about equal to
the 85046A)
- 87511A
is very similar to the 85046A except it is rated for 100 kHz
to 500 MHz. The "B" version is for 75 Ohms.
- Other HP/Agilent test sets also will work but may not be
cost competitive.
- For a simple way to measure S11 I am trying a Mini Circuits
ZFDC-10-1
Coupler. Spec is 1 to 500 MHz. The connection is:
- RF Out to coupler IN
- coupler CPL to A
- 4395A ports R and B not used.
- keystrokes: Preset, MEAS\analyzer type\network\more\A,
CAL\calibrate menu\S11 1-port connect open. short and load
then Done
The screen dump of the same 50 Ohm
Termination used for the cal (using 16 averages, for both
cal and measure) shows pretty good performance from 2.5 MHz on
up. The 4395 needs to warm up for at least 30 minutes,
otherwise the calibration will change a lot. After adding
a Splitter (3 each 16 2/3 Ohm resistors in the "Y"
configuration): RF Out to Splitter, Splitter to 4395A "R" port
and to the input of the Mini Circuits ZFDC-10-1
Coupler CPL output of coupler to 4395A "B" port (it is
near edge and closer to me). For BNC cal standards I am
using:
- Open = just air
- Short = a BNC shorting Plug that used to have a chain
from my junk box
- Load = Radio Shack 278-270
BNC 50 Ohm Load (selected from a number for 50.0 Ohms at DC)
Prior to cal Averages was turned on (Bw/Avg key) and the default
16 averages was used. The 4395A had warmed up for many
hours. Just after cal the return loss was around 60 to 70
dB. The next day the return
loss is better than 40 dB. Note that this is a
repeatability test since I am measuring the same load as was
used during the calibration. I have not yet tried making
some type of verification standard. The reference channel
really helps! There are a couple of short BNC cables
and a BNC(m) barrel in this setup. If these cables are
wiggled the return loss will degrade. That's the nice
thing about a test set, all the connections are stable.
- 43961A (see below) - This was made for
the 4396 combination Network/Spectrum/Impedance analyzer the
came before the 4395A and so covers it's frequency range of
100 kHz to 1.8 GHz. The test port is an APC-7 connector
facing up and has two posts to hold a family of 7mm test
fixtures.
- 41951A - This is very similar to the 43961A, but was made to
work with the 4195 over the 100 kHz to 500 MHz frequency
range. Note that the 4395 was designed to replace the
4195A. Like the 43961A it holds the 7mm plate type
fixtures.
4380A
 I worked at HP/Agilent in Santa
Rosa, CA on the 4380S system for a couple of years. (see
1998 catalog page 269) This was an HP idea ahead of it's
time. HP pioneered 10-BaseT (Wiki)
so that existing phone wiring could be used for computer
networking instead of pulling new coax. Later this was
upgraded to 100-BaseT which evolved into CAT5 (Wiki)
cabling. These networking methods use Unshielded Twisted
Pair "UTP" (Wiki)
and the electrical characteristics of this balanced line are very
important. Prior to the 4380S balanced test system pairs
were measured using BALanced to UNbalanced "BALUN"
transformers (Wiki).
But as the frequency of LAN cabling increased the unknowns in the
balun introduces a lot of error. Also there are no calibration
standards for balanced line. The 4380A test set was part of
a system used to characterize balanced LAN cables at and above the
CAT5 level. This system requires either an 8751A,
4395A or 4396B analyzer, a computer running the Rocky Mountain
Basic software and the 4380A test set.
I worked at HP/Agilent in Santa
Rosa, CA on the 4380S system for a couple of years. (see
1998 catalog page 269) This was an HP idea ahead of it's
time. HP pioneered 10-BaseT (Wiki)
so that existing phone wiring could be used for computer
networking instead of pulling new coax. Later this was
upgraded to 100-BaseT which evolved into CAT5 (Wiki)
cabling. These networking methods use Unshielded Twisted
Pair "UTP" (Wiki)
and the electrical characteristics of this balanced line are very
important. Prior to the 4380S balanced test system pairs
were measured using BALanced to UNbalanced "BALUN"
transformers (Wiki).
But as the frequency of LAN cabling increased the unknowns in the
balun introduces a lot of error. Also there are no calibration
standards for balanced line. The 4380A test set was part of
a system used to characterize balanced LAN cables at and above the
CAT5 level. This system requires either an 8751A,
4395A or 4396B analyzer, a computer running the Rocky Mountain
Basic software and the 4380A test set.
The principle of operation is to connect each wire to a test
port, so 8 test ports are needed to connect both ends of 2
pairs. After a full calibration (or by using symmetry the
4380S software has calibration routines that take much less
time) all the S-parameters are measured. The S-parameters
can be transformed, first into Z-parameters, to result in either
balanced parameters or unbalanced parameters. This allows
characterizing balanced devices, like LAN cables, and also
balanced to unbalanced devices, like BALUNS.
The system impedance, which in the past was a hardware option
("A" suffix on the above test sets for 50 Ohms or "B" suffix
for 75 Ohms) is a software option with the 4380S system.
Early versions of the 4380S used an HP Rocky Mountain Basic workstation
like the 9000 series. Later versions ran under Rocky Mountain Basic for Windows.
The last version would run with the 4396B, extending the upper
frequency limit to 1.8 GHz.
Agilent has discontinued the 4380S system and sold it to a
company called ATN
Microwave that as part of it's product line has balanced
test sets, that are different in that they work much higher in
frequency, but have only up to 4 ports. Aimed more at
modern wireless devices than at LAN cable.
The 4380A test set has a built in Open, Short, Load test port
to minimize the time needed for an 8 port calibration.
By using a conventional SMA Cal kit on one test port
cable end and also using the internal reflection cal standards
the cal kit values can be transferred to the internal cal
measurements. Using the built in test port is much much
faster than manually connecting OPEN, SHORT and LOAD
terminations to the end of eight cables. But you still
need to connect eight cables to the test port.
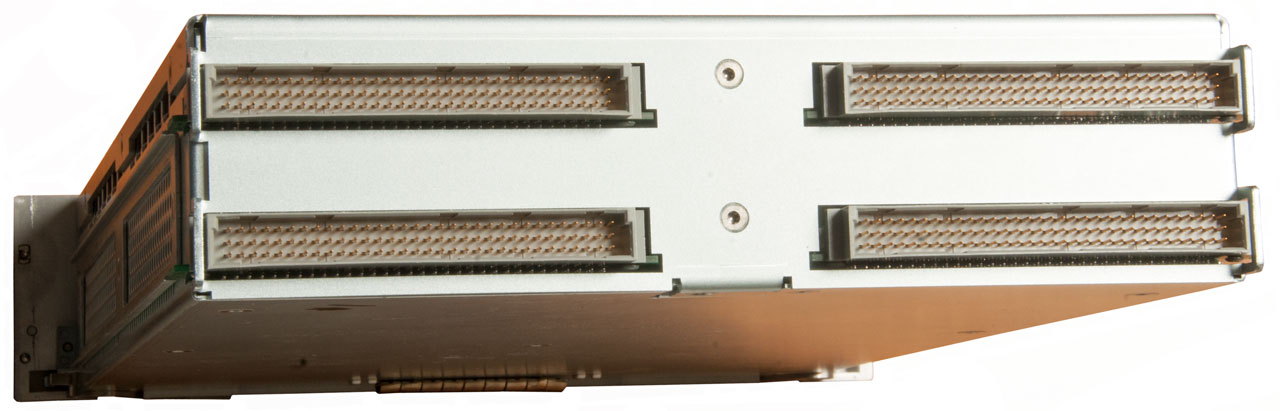
There are no control buttons on the front panel of the 4380A
so you need to control it using the DB-15 connector on the
rear panel. IBasic program (4380MC.txt) that runs inside
the 4395A Network Analyzer to control the Source, A receiver,
B receiver and termination. This version uses the soft
keys for control and that makes using the soft keys for cal
difficult. A better way would be to use the
display/more/disp alloc/Basic status for the program I/O and a
PS2 keyboard for the 4380A control.
The 4380S typically used the 3.5 mm (SMA) cal kit and SMA
type cables between the test set and the test fixture.
If the test cables have any movement between the time of
calibration and measurement then an error may be introduced in
the final result. So, while flex SMA cables are very
easy to bend (shape to connect to the text fixture) using old
fashioned 0.141 semi-rigid coax and a bending tool results is
a more stable test setup.
The insertion loss from the input connector to the selected
source port is about 20 dB from 1 kHz up to maybe 2 GHz.
The insertion loss from the source port to either the A
(top) or B (bottom) output ports is about 14 dB. The IL
from the input port to Reference port is about 34 dB, the same
as the sum of the prior two.
Control Software
Network Analyzer Cal Kits
The 4395A has parameters for the following calibration kits built
into the firmware:
- 7 mm 85031B
- 3.5 mm 85033D
- 50 Ohm N 85032B
- 75 Ohm N 85036B
You may want to use other cal kits and there is a "user"
cal kit that can be setup to use any cal kit for which you know
the required parameters. It turns out that all the cal kits
have generic data. The cal kit parameters are not serial
number dependent. The manual for each cal kit has the
required parameters printed near the back. I wrote an
I-Basic program that could be run either in an external Rocky
Mountain Basic compatible computer or can be run inside the 4395
(or 4396) to load any of the cal kits offered by HP/Agilent that
make sense for the 4395A.
Couplers
There are many types of couplers but understanding the simple
coax 10 dB type will help in understanding all of them.
When using a coupler as a reflectometer the labels intended for
coupler use are no longer valid for this use. The
connections shown below are one way to connect for reflectometer
use, but there's another way where you swap the signal generator
and the coupled output ports. Which of these two you use
depends on where you want the higher path loss and where
the lower path loss, between the signal generator and the DUT or
between the DUT and the coupled output.
|
|
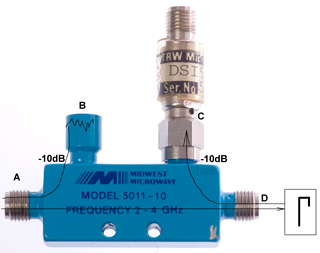
A reflectometer application is shown above. A signal
source is connected to the A port. There's a small
fraction of a dB loss to the D port where some Device Under Test
(DUT) is connected. The DUT has some complex reflection
coefficient and reflects a signal most of which goes back to
port A, but a tenth of the reflected signal is coupled to port C
where it can be measured.
Note that a tenth of the input signal is coupled to port B,
which in this case it terminated in a 50 Ohm load.
Note when measuring reflection coefficients, as in the diagram
above, the impedance looking out from port A should be very good
to prevent interaction of VSWRs.
In a coupling application a signal source might be feed into
port D and the coupled sample on port C might be used in a
leveling loop or used as a sample of the source signal.
So how the coupler is labeled depends on how it's to be used.
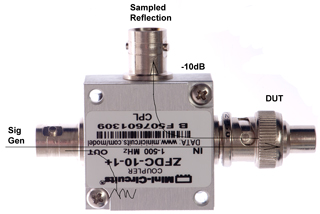
For the case of the ZFDC-10-1+ coupler it's reflectometer
connection is:
Signal source to OUT
Sampled reflection out of CPL to input port on network analyzer
Device Under Test on IN
ZFDC-10-1 Coupler Frequency Response
By using a coupler as a test set S11 (aka VSWR, Smith chart,
etc.) can be measured. This can be a full vector error
corrected measurement if open, short and load calibration
standards are used.
By setting Sweep - Sweep Type - Log Freq. you can see much
more at the low end. The coupler works very well above 50 kHz.
That's much lower than the specification of 1 MHz.
Measuring Cable Length
Connect the cable to the OUT port of the coupler
At the far end of the cable connect a short
Format - Delay
Marker - 51 - M/u (sets the marker to 51 MHz), the frequency is
not too critical since the display is almost a straight line
Read the delay in the top right hand corner (19.262 ns, is about
19 feet out and back in air. this cable is 6 feet of
RG-58A/U. 2*6/19.262 = .623vel factor) (1/C =1/186,000 miles per
second = 1.0182 Ft/nsec. )
With just the stock 4395A you can do impedance
measurements, see the Z:Transform method. Option 010 which
is the firmware to calibrate, measure and display impedance and a
test set like the 100 kHz to 1.8 GHz 43961A.
This unit has an APC-7 connector pointing up and a couple of pins
also pointing up. These are there to accept a wide range of
7mm impedance plate type test fixtures.
You can use the marker on a Smith Chart display to read out
impedance values, you just can not get the nice impedance
displays that come with the option 010 firmware. The
accuracy of a Smith Chart measurement for impedance purposes is
not very good, the 43961A is somewhat better.
There is a good Impedance vs. frequency graph in app note 346-4
8
Hints for Successful Impedance Measurements
(5968-1947E) the shows the areas covered by different types of
impedance measuring instruments.
43961A
The 43961A was made for measuring
impedance with the 4396A/B combo boxes that cover 100 kHz
to 1.8 GHz. It is a V over I method of measuring Z
rather than a reflectometer method. This is described in
the Impedance
Measurement Handbook (5950-3000). This method has
more accuracy than 50 Ohm reflectometer network analyzer for
impedance magnitudes that are not close to 50 Ohms.
The upward pointing APC-7 connector and the two posts are
designed to hold one of a number of test fixtures described in
the Accessories Selection Guide For Impedance
Measurements (5965-4792E) The 7 mm fixtures
start on page 45. They are:
16092A Spring Clip Fixture - a general purpose fixture for both
axial lead and end contact SMT components
16093A Binding Post Fixture - for leaded components
16093B Binding Post Fixture - has two ground lugs with different
spacing to the hot binding post
16191A Side Electrode SMT component fixture
16192A Parallel Electrode SMT Fixture - 1 to 20 m long parts to
2 GHz
16194A 200oHigh Temperature SMT Fixture -
16196A Parallel Electrode SMT Fixture - 0603 parts to 3 GHz
16196B Parallel Electrode SMD Fixture - 0402 parts to 3
GHz
16196C Parallel Electrode SMD Fixture - 0201 parts to 3
GHz
16197A Bottom Electrode SMD Fixture - 0402 to 3225 parts
16094A APC-7(m) Probe - mates to an APC-7 cable
16200B External DC Bias Adapter - to 5A or 40 Volts
16453A Dielectric Test Fixture - uses flat sheet samples
16454A Magnetic Material Test Fixture - must have toroidal
sample
When used with the 4395 the low frequency coverage does not go
quite all the way down to 10 Hz, but maybe down to 1 kHz using a
Network Analyzer S11 calibration.
The 43961A comes in a suitcase that's about 16" x 12" x 4.5" and
includes the fixture, a short N(m) to N(m) cable for the source
(Note that is the source cable changes due to any motion, that
change will be canceled out by the Reference channel.). APC-7
Calibration standards of 50 Ohm Load, Short and Open. The
open is actually the axial lead test fixture that has a 7 mm
bore that was used with the 4191A Impedance analyzer.
That's why there is a threaded hole in the top, to hold the
axial lead attachment fitting. It's marked 04191-85302 D:
7 mm, H: 20 mm. There also was a 10 mm bore axial lead
fixture.
There's also a couple of 3.5" floppy disks:
One is marked "HP 4396A Sample Program for External Controller
Rev A.01.00 p/n 04396-61002 Disk 1 of 2"
The other is marked "Sample Program Disk for HP Instrument
Basic" Rev. A.01.00 p/n 04396-61002 Disk 2 of 2"
There's a second 3.5" floppy disk wallet with a blank disk and
label. The programs on the disk seem to be small example
programs, identified by Figure numbers, from the 4396A/B
programming manual.
42961A is not directly useable on a 4395 or 4396 that does not
have the $1k optional impedance firmware installed. This
because the V (voltage) reading is on the R ( Reference) port
and the I (Current) reading is on the A (left) port. If
you make an A/R measurement you get I/V (i.e. admittance).
Also the manner in which the calibration factors are determined
and applied for a reflection measurement, like S11, is
completely different from how you make a V/I Impedance
measurement.
43961A Results with no calibration at 1 MHz (dB @ degrees /
mag @ deg)
|
Short
|
Open
|
50 Ohm Term
|
A
|
-6.06 @ 65
0.2477 @ 65
|
-97.8 @ 141
1.6595E-10 @ 141
|
-32.3 @ -64.3
5.83E-4 @ -64.3
|
R
|
-6.6 @ -116
0.218 @ -116
|
-0.795 @ -111
0.8327 @ -111
|
-3.24 @ -112
0.474 @ -112
|
A/R
|
-19.69 @ -178
|
-97 @ -113 |
-29.1 @ 177
|
|R/A|*
|
0.88
near zero
|
5E9
near infinity
|
813
not too near 50?
|
Since the A port is the current through the DUT it is minimum
with an open test port and maximum with a shorted test
port. Note this a lot different from a reflectometer that
has the same max. magnitude with either an open or short and is
minimized with a matched load.
Changing the test port value has a little effect on the R port
value, which in a perfect world would not happen. But if
the value of the R port reading is really the voltage at the
DUT, then this is a good thing in that it results in a more
accurate impedance measurement. This very well may be the
case since there are three small coax cables going up into the
APC-7 test port connector, one of them being for the R port.
* calculated without regard to the phase angles.
Looking at just the A port:
with a short as the DUT, the response rolls off (down) from -20
dB as you go down in frequency below 20 kHz at 12 dB per octave.
with an open as the DUT the response rolls off (up) from -120 dB
as you go up in frequency above 1 MHz. This means that for
frequencies in the 20 kHz to 1 MHz area the dynamic range of the
43961A is about 85 dB and it's about 30 dB at 2 kHz and
100 Mhz. This probably has some bearing on the
accuracy. Interesting that 1 MHz, a common frequency on
LCR meters is in the sweet area of the 43961A, allowing
correlation at the same frequency.
If you have the 4395-010 Impedance software contact
me
16 July 2003 - I have figured out how to calibrate the V/I test
set. Just to confirm some things I connected the 43961A to
the 4395A upside down. This connects the 43961A "R" or V
signal to the 4395A A port and connects the 43961A "A" or I signal
on the 4395A R port, now when the 4395A is set to display "A/R"
the display is LOG(|Z|) and phase(Z). Using this setup I
have manually confirmed my calibration math.
17 July '03 -Bummer, IBasic does not support the COMPLEX file type
that normal RMB uses. Can maybe just do a magnitude only
correction, or do the Vector correction in LabVIEW, or with a lot
of effort do a vector correction in IBasic?
Z Transform Impedance Method
The metal box connects the outer conductor and the
center conductors are brought out to binding posts. Short
the binding posts to each other when doing the response THRU cal.
Background
With a stock, no options, 4395A you can measure impedance without
any test sets over the full frequency range of the Network
Analyzer (10 Hz to 500 MHz). The result can be displayed as Log
Mag, Lin Mag, Phase, Real or Imaginary.
One of the key features of the 4395A is it's low frequency
coverage. The overall frequency coverage is about 8 decades,
that's very wide. The 43961A was made for the 4396A and so
does not work very well below 100 kHz which eliminates VLF and VF
testing.
Before I discovered this method I was using the same connection
and measuring S21 and then using a spreadsheet to convert from S21
into impedance. Now I let the 4395A do that math.
There is an option under Meas/Conversion for displaying
Z:TRANS, the impedance when the DUT is inserted in series
with a transmission path, like an S21 network analyzer
measurement. The Lin Mag can be displayed and reads out
directly in Ohms. If the Log Mag display is selected you can
convert back to Ohms using Ohms = 10^(dB/20).
E5100
The E5100() Network Analyzer uses this Z:TRANS connection method as well as the E4915
crystal impedance & E4916 crystal impedance/LCR meters.
The Network analyzer method that is covered in 8 hints for
Impedance measurements, pub # 5968-1947E, is the reflectometer
method. But it also mentions transmission as having the same
type of errors. So making up a circuit similar to the 40 dB
attenuator above that transforms 50 Ohms up to some higher value
(or to some lower value) that's closer to the |Z| you are
measuring, the more accurate the result will be.
The IEC-444 Specification (PI-Network Measurement
of the Load Resonance Frequency without Load Capacitor.pdf)
- From the crystal point of view the PI-Netowrk looks like 12.5
Ohms at both the input and output, or 25 Ohms external loop
resistance. The network also includes shunt capacitors to
trim the series phase to zero. (Corning:
Technical Introduction Crystals.pdf, PI-net: pdf pg
14)
The HP 41900A Pi Network Test Fixture also included a number of
load capacitors. IEC444
The HP 41901A SMD PI Network Test Fixture also included a number
of load capacitors. QIAJ (Japan)
The E4916A Options:
001 - Impedance Probe Kit
010 - LCR Measurements - eBay has titles that include
Impedance/LCR, but the unit may not have option 010?
adds LCR probe HP 16099A capability.
E4916U - upgrade kit adds both 001 & 010 - OBSOLETE
How it Works
The Device Under Test (DUT) is connected in series with the center
conductor between the Source and "R" receiver. The shield is
continuous from the source to receiver. Calibration can be
as simple as a response/thru cal. Setup, where [hard key]
and (soft key):
- Measurement area [Meas], (analyzer type) (network analyzer)
- Measurement area [Meas], (CONVERSION), (Z:Trans)
- Sweep area [Sweep], (SWEEP TYPE), (LOG FREQ) - this makes
most LF and VF plots easier to understand.
- Measurement area [Format], choose from (LOG MAG), (PHASE),
or (MORE) then (REAL), (IMAGINARY).
Note that when using LOG MAG you can convert dB
back to Ohms using:
Ohms = 10 ^ ( dB / 20 )
It's convenient to set the Measurement area, [Scale Ref],
{REFERENCE VALUE) to zero (i.e. 1 Ohm) and the (SCALE/DIV)
to 10 dB (every 2 divisions is 10 X impedance, or 20 dB
(every division is 10X impedance.
The 4395A does the transformation math so the display is the
device impedance since it knows how the device is connected.
I have seen strange things when using the "A" or "B" receivers and
if a power splitter is used. The best results are with a
simple source to "R" connection.
Calibration
Before doing the CAL you may want to change to
Measure, Network, R (you can also use A or B and if you have a
splitter then use A/R or B/R)
Also change to Sweep, Sweep Type Menu, LOG FREQ.
The RBW (Measurement, Bw/Ave, IF BW) should ideally be 10 times
smaller than the start frequency. The best you can do is 1
Hz RBW.
If the RBW is equal or larger than the START frequency the trace
will have a lot of noise at the low frequency end.
The very simple Measurement area, [CAL], (CALIBRATE MENU),
(RESPONSE) can be used.
With the fixture shorted use only the THRU option then DONE.
Typical values after calibration are: 44 milli Ohms for
the short and 1.2 Meg Ohms for the open.
If the fixture capacitance is a problem then use . . .
(RESPONSE & ISOL'N) with the (THRU) option when the fixture
is shorted and after the short is removed use the (ISOL'N STD).
Typical values after the calibration are: 117 milli Ohms
for the short & 13 Meg Ohms when open.
Verification
If a resistor is connected and Measurement, Format is set to
MORE, Real then and MARKER pressed the value should be the
value of the resistor (allowing for it's tolerance).
When showing LOG Frequency and Measurement, Format LOG Mag a
capacitor will show as a straight line sloping down to the
right with a slope of -20 dB per decade of frequency.

|
ignore the 2 preceding the Z it's a typo.

|
To convert log MAG into Ohms use:
Ohms = 10 ^ (dB/20)
For example at 2 kHz 120.52 dB = 1,061,696 Ohms
Note: for a Response cal the open impedance is just over
1 M Ohm, see above.
and at 20 MHz 48.958 dB = 280.5 Ohms.
Note this is combined real and imaginary so may not be
equal to the imaginary
values shows at the right.
The frequency range below about 20 kHz is noisy because
of the RBW being
close to the test frequency instead of being 10 or more
times smaller.
|
The calculated capacitive reactance is:
2 kHz: -3,180,000j
20 kHz: -318,000j
200 kHz: -31,800j
2 MHz: -3,183j
20 MHz: -318j
Using -285.5 Ohms the capacitance is (1/Xc)/(2{PIf) =
27.87 pF
Cap marked 27 in bag marked 25.
|
An inductor will slope up to the right at +20 dB per decade
of frequency.
Z:Trans Fixtures
No Bias Fixture
This is a simple Ponoma metal box
with a couple of BNC connectors. The metal box connects the
shields and the center conductors are brought out to a couple of
binding posts. The separation of the binding posts needs to
be close enough to connect the DUT but as far apart as possible to
minimize leakage capacitance.
This fixture has about 65 pF series capacitance.
Another fixture could be made for measuring crystals that would
have the standard PI network installed. If the impedance
looking back and the source and into the "R" receiver from the DUT
is other than 50 Ohms then you need to change the Zo value at
Measurement area, [CAL], (MORE), (SET Z0).
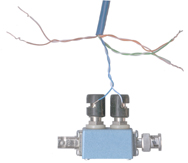
Bias-T Fixture
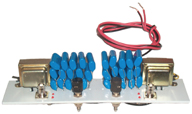 This fixture was made using 2
Radio Shack Filament transformer primary windings for the 2
inductors and the two large DC blocking caps were made by
paralleling 15 each 2.2 uF 250 Volt Mylar caps. Each of the
BNC connectors that go to the 4395A have a pair of LEDs connected
from the center conductor to ground. That way you can
experiment with the fixture disconnected from the 4395A to see
what lights the LEDs and AVOID doing that during the
testing. The danger is that the caps or inductors will get
charged and dump their energy into the 4395A letting the smoke out
and giving you gray hair.
This fixture was made using 2
Radio Shack Filament transformer primary windings for the 2
inductors and the two large DC blocking caps were made by
paralleling 15 each 2.2 uF 250 Volt Mylar caps. Each of the
BNC connectors that go to the 4395A have a pair of LEDs connected
from the center conductor to ground. That way you can
experiment with the fixture disconnected from the 4395A to see
what lights the LEDs and AVOID doing that during the
testing. The danger is that the caps or inductors will get
charged and dump their energy into the 4395A letting the smoke out
and giving you gray hair.
See the model 500 dial phone tests on
my Zo web page for more on using this fixture.
This fixture was made for testing in the Voice Frequency range,
but a similar fixture could be made that covered the full range of
the 4395A.
10X Scope Probe
It occurs to me that you could use a 10X Scope Probe. The
probe is designed to divide the input voltage by 10 when the probe
is connected to a scope with 1 M Ohm input resistance. But
when connected to a 50 Ohm input the division ratio is in the area
of 20,000 times or about 43 dB. The dynamic range of
the 4395A can handle that for many applications so this may be a
good way to get DC voltage attenuation and/or a high impedance
input. The frequency compensation will be wrong, but with
such a low load resistance should still be very good.
Other Impedance Info
HP 4191 & 4193 patent
5345182 Impedance meter capable of performing measurements
at high precision over wide impedance and frequency ranges Sep
6, 1994
324/649;
324/522;
324/654;
324/713
This is the patent that covers the V/I type impedance
measurements pioneered in the HP 4191 and 4193 instruments and
later used on others. It works at frequencies higher than
can covered with the very high accuracy Four Terminal Pair
method.
Save State
There are a lot of key presses to get the Z:Trans method
working. Once you are happy with a setup it makes life much
easier to then save the instrument state by being sure the:
Instrument State, [Save}, (STOR DEV) is set to DISK, then in the
Instrument State area, [Save], (STATE). If you connect a
standard PC keyboard to the 4395A (cannot use PC keyboard on the
older 4396A) it's much easier to enter the file name and you get
upper as well as lower case letters.
By using a PS2 Keyboard & VGA Monitor (Wiki)
switch you can just press a button to switch your keyboard
and monitor back and forth between your computer and the
4395A. This makes looking at the display much easier and
larger. This was true in the day of PS2 keyboards (Wiki) but no
longer the case with USB keyboards and mice.
To get the 4395A back into that state be sure the floppy disk is
installed, then in the instrument State area, [Recall] which after
a few seconds of reading the disk directory will display all the
available states as softkey choices and you just press the one you
want. If you have saved IBasic programs from the 4395A to
floppy they'll also show up as softkey choices.
Signal Generator
In the N.A. mode you can set the Sweep\Source Power from
-50 dBm to +15 dBm and the CW frequency from 10 Hz to 510 MHz (yes
a little more than 500 MHz). Instead of using the CW
frequency you can set the start and stop frequencies and number of
points to generate a ramp that will show up as an FM modulated
signal that will pass through the audio output of a receiver.
In S.A. mode with SPAN set to zero you can set the signal
generator to the same ranges.
Note that in either case the signal generator is coming from
the respective function (N.A. signal source or S.A. local
oscillator), so the mode will have limited or no use when the
signal generator is being controlled directly.
Floppy Disk Drive
The drive will accept today's standard double sided high
density (1.44 MB) type disk used on a PC. When you
Initialize (format) the disk using FORMAT [DOS] and STOR DEV
[DISK] the disk will be just like a normal PC 1.44 floppy
and the title will be HP4395 (even if the 4395A has an Agilent
logo). The disk can be read on a PC. But the HP LIF
format can not be read on a PC.
I don't think pre-formatted HD floppy disks will work, but they
may if the 4395 formats them as standard density?
Initialize Floppy
In the Instrument State box press the [SAVE] button.
Choose the on screen menu item: File Utilities, then Initialize
Disk, then toggle Format[DOS] so that DOS is selected, not
[LIF]. This way a PC can read the disk.
Then select Init Disk[Yes].
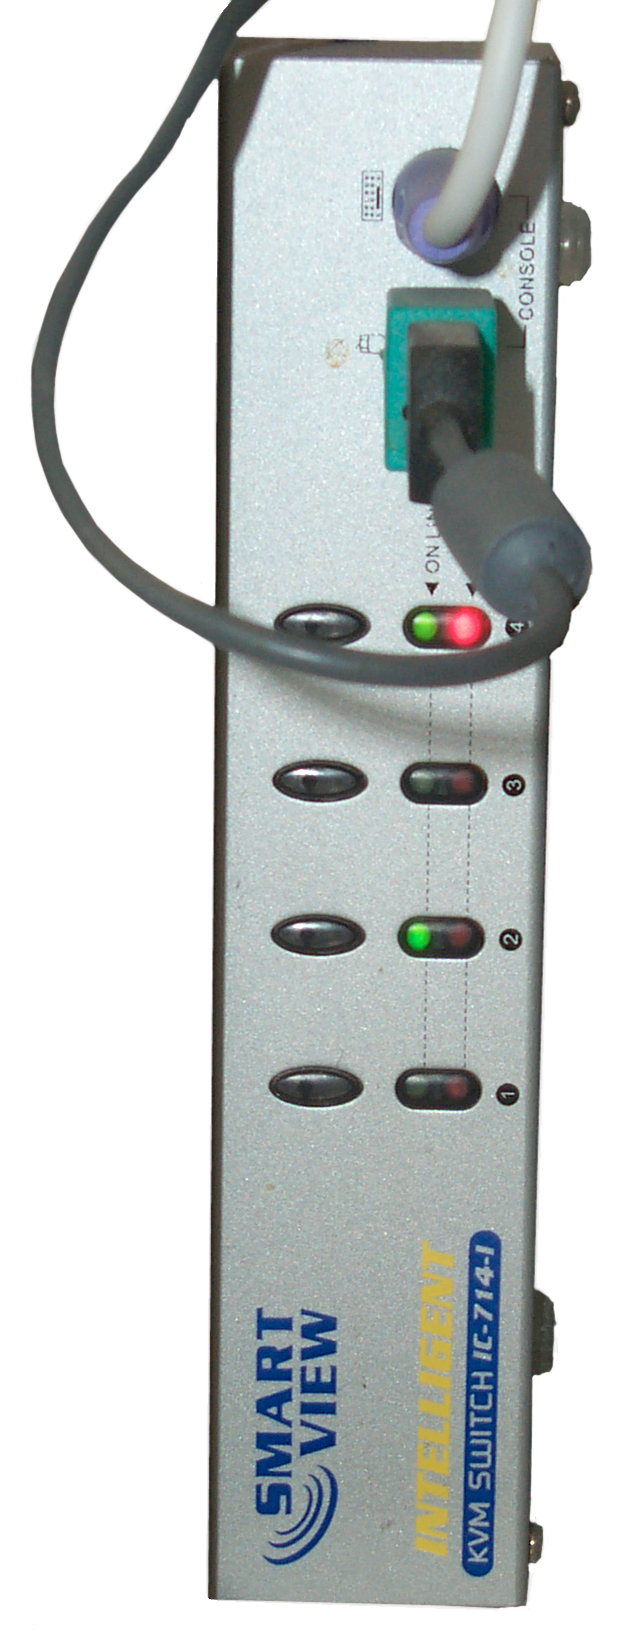
Display, Keyboard & Mouse
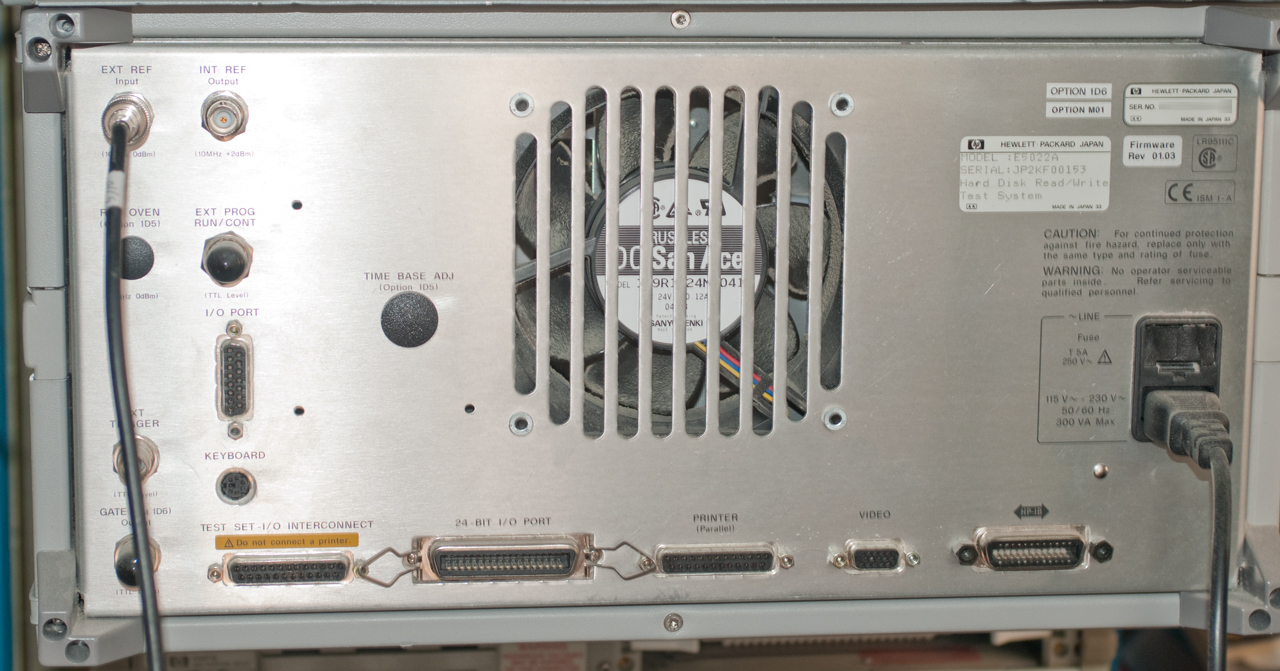
The screen video and a keyboard can be connected to rear panel
jacks. By using a PC switch box these can be connected to
the VGA monitor and PS2 keyboard associated with your
computer. The computer monitor is a much larger screen and
the keyboard is great for entering file names when saving screen
shots. This box is also connected to two computers and has
one free input port. A good thing would be to find a scope
that can put it's display on the monitor.
Time Gating
By using time gating only signals that occur in the allowed
time window will be analyzed. When testing hard disk
drives with the E5022A or
E5023A spin stand systems you can restrict the analysis to only
a specified sector of the disk. There was a version of the
4395A spectrum analyzer (only) made in VXI format named
the E5040A used in the E5023A system.
Applications
Audio
Checking a dynamic microphone on the H-250
Handset
Remember that the bandwidth needs to be much narrower than the
lowest test frequency. When the default BW of some kHz is
used with a lower frequency like 20 Hz the lower part of the
display has a lot of ripple that will go away when the BW is set
to 10 or 3 Hz.
Amplifiers
By using an antenna to monitor a transmitted signal
and switching an RF amplifier in and out of the transmitter
circuit you can see the gain of the amplifier. This avoids
the need for high power attenuators which would be needed for a
direct connection.
OF-185 Amplifier gain -
Antennas
In spectrum analyzer mode you can compare different
antennas to see which gives stronger signals
OE-254 vs. Radio Shack
T2FD vs. DA-100 @ 15 MHz note the
difference in noise level and signal strength.
In Network Analyzer mode you can measure the Smith Chart.
OE-254 Smith Chart
The AMRAD LF active whip antenna
was found to have a noise floor problem that was very easy to
see using the 4395A. Before and after modification plots
are on the web page for the antenna. This type of
problem would be very hard to detect any other way.
An ideal receiving antenna should have good signal to noise
ratio for the desired signal and reject unwanted signals.
What "good" means depends on what's going on. For
example for a TV signal to look excellent and without any
trace of noise you need about 48 dB s/n. Some slow speed
digital modulation schemes will recover a an error free copy
of the transmitted signal with a s/n of maybe -20 dB (note the
minus sign).
A spectrum analyzer is a great tool to look at receiving
antenna s/n ratios. The network analyzer is great for
measuring antenna properties. 12 May 203 working on
Ferrite WWVB 60 kHz receiving loop
antenna.
The inductance can be calculated from the series resonate
frequency in an S21 measurement, but the HP 4332 LCR meter goes nuts because
the loopstick is picking up strong signals from the computer
monitor and who knows what. The insertion loss at series
resonance allows the effective AC resistance of the coil to be
easily calculated. For 50 Ohms source and load (like the
4395):
R = 100 * [ 1/ (10^(dB/20)) -1]
Example for -1.0 dB R = 12.2 Ohms
Note that in a vector network analyzer the receiver is phase
locked to the source and so external signals have minimal to no
effect.
Crystal Oscillators
Many radios use crystals to set the receive and/or
transmit frequency. By using the 4395A in spectrum
analyzer mode and connecting the radio antenna to the analyzer,
you can see most of the crystal frequencies either at the
fundamental or some harmonics. CAUTION - Do not transmit into
the 4395A without making some provision to reduce the power so
as to not smoke the 4395A. For transmitter testing I
connect the 4395A to an outside antenna and use the hand held
radio with a short antenna. The 4395A is acting like a
receiver.
Finding the Crystal frequencies and the
formula for the URC-68 radio.
Confirming that crystals are active in a
PRC-68A radio.
Crystal Equivalent Circuit
By connecting a crystal in series and
measuring the S21 mag and phase in Network Analyzer mode a
computer program should be able to curve fit and come up with an
equivalent circuit since the circuit is
already known only the values would need to be fit not the
topology.
Phase Noise
One of the ways of making a phase
noise measurement is to just look at the signal on a spectrum
analyzer. With the older analog non synthesized analyzers
this did not work very well, but with a synthesized analyzer you
can get useful information although there are corrections for
the non square RBW analog filters and for the peak detector used
in analog units. But the 4395A has very steep skirts on
the digital filters and has a true RMS detection mode that works
by squaring the I and Q signals. When these options are
selected using the on screen menu that display is directly in dB
per root Hz.
User-Friendly
Phase-Noise
Measurement for HP and Tektronix Spectrum Analyzers - this
free software may work with the 4395A. haven't tested it.
Spectrum Plots
0 to 200
kHz
200 to 400 kHz
40 to 50 MHz 3 Hz RBW, Max
hold, many days
118 to 136 MHz
136 to 138 MHz
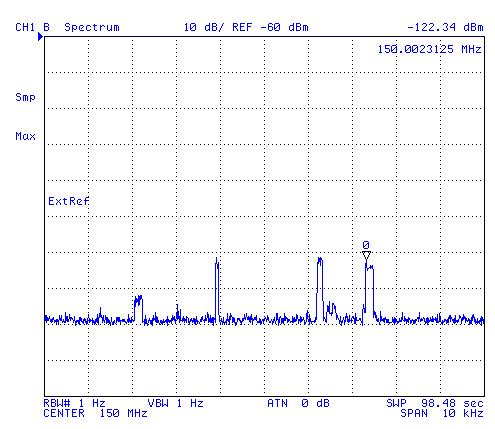
150 to 154 MHz
153 to 157 MHz
150 MHz center freq, 1 Hz RBW, Max hold, 24 hours - looking for
satellites and found 4 of them. (17 Apr 2013).
The Doppler (
Wiki)
effect causes the frequency of the satellite to change.
The width shown on the spectrum plot is determined by the
satellite elevation.
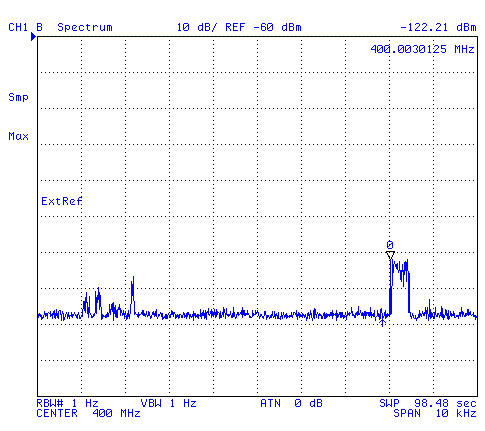
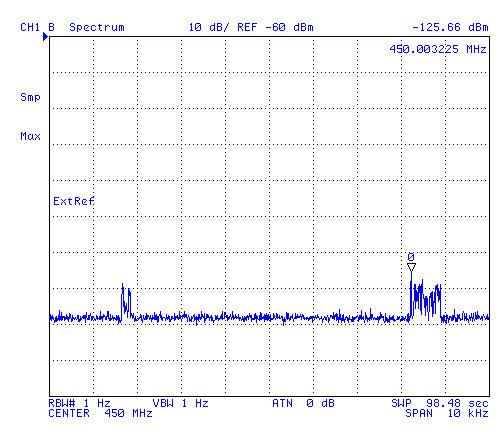
400 MHz center freq, 1 Hz RBW, Max hold, 24 hours - looking for
satellites and found . . . 1
450 MHz center freq, 1 Hz RBW, Max hold, 24 hours - looking for
satellites and found . . . 2
VCO Testing
When the option 001 (A2 PCB) Programmable DC supply is
installed an output of up to �+/-40.001 V < �100.02 mA of DC
voltage/current can be programmed.
While the 04395-90010 (page 319) does not mention noise, AFAICR
it's very low to allow testing Voltage Controlled Oscillators (Wiki).
A better way is to use the HP 4352B VCO test system.
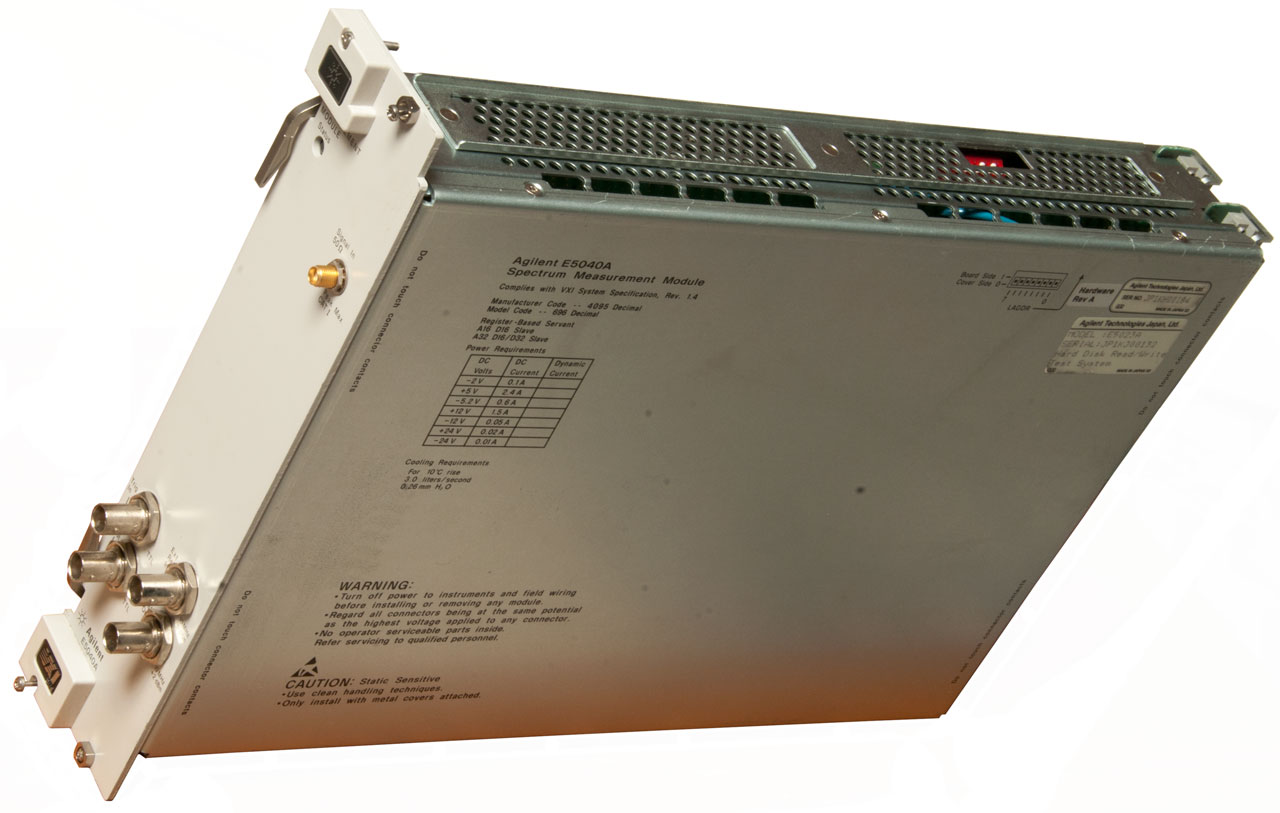
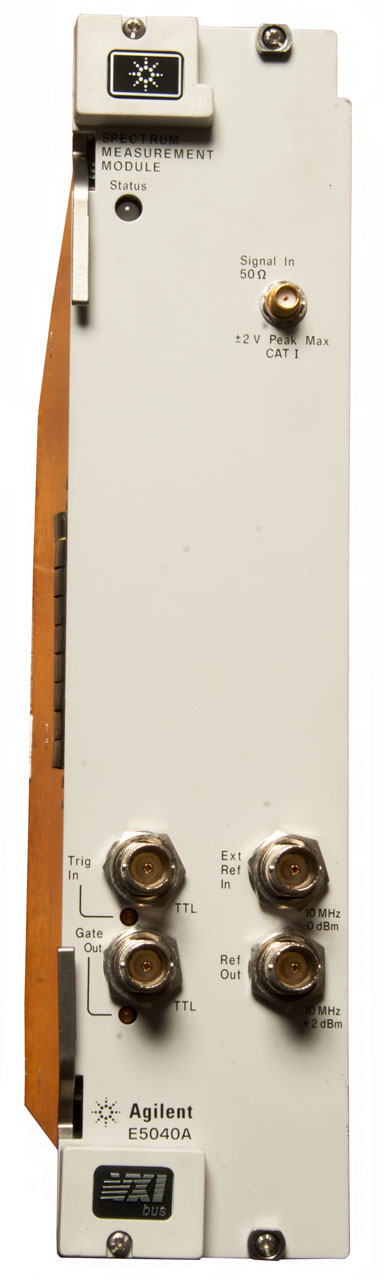
E5040A VXI Spectrum Analyzer
This is the Spectrum Analyzer part of the 4395A. There is no
impedance or network analyzer capability, only spectrum.
It was part of the E5023 Hard Disk
Test System.
This is a Series C size VXI module and needs either a computer
in the VXI cage or an adapter to a computer in slot zero.
It does have the option for time gate in order to measure
various sectors of a hard disk. The Gate out can be fed to
an oscilloscope so that you can adjust it via software to cover
the sector desired. It also has external reference in and out to
frequency lock with the test generator.
The manuals for the E5023 system do not cover the E5040A. Just
use the 4395A commands applicable to spectrum analysis with the
E5040A.
Keysight: VXI
Mainframes & Controllers -
E1406A
Command Module C-Size
E8491B
IEEE-1394 PC Link to VXI C-size
E8401A
C-Size 13-Slot Mainframe
E8403A
C-Size 13-Slot Mainframe
E8408A
C-Size 4-Slot Mainframe - like the small size.
E8491B
Firewire Controller C-Size - FW replaced by USB2 so not a good
choice.
E1406A
Command Module C-Size - GPIB, RS-232, Slot 0, and Resource Manager
- link to computer not one itself - Docs available
E4220B
Transportable VXI 7 Slot Housing - Monitor, Keyboard &
Trackball, no documents (the A version also has no documents)
V743
C-Size Controller based on the 9000 Series HTB computers. uses
PS/2 (Wiki)
keyboard and mouse & SCSI hard drive interface
The E1421A C-Size 6-Slot Mainframe has been replaced by the E1421B
with many support documents
eBay search terms: "(HP,Agilent,Keysight) VXI Mainframe"
Note B-Size is the same as B-Series and smaller than this C-Size
spectrum analyzer.
Reference Information
The 4191A was a precursor impedance analyzer to the 4395A.
The 4195 was the direct precursor. Here are some YouTube
videos about the 4191A:
4191A part 1 an
introduction - Visual
Basic for Excel, Simple Example Program to Control Instruments,
Jan
1980 HP Journal,
4191A part 2 the software
- Based on Excel
4191A part 3 calibration
- short, open , load
4191A Part 4 making a
measurement using Z plots - Link to ZPlots
with thanks to Dan Maguire
Agilent -Keysight
- 4395A top web page-
Product
Specifications -
Related
Accessories -
5965-9374E.pdf
- Awareness Brochure for the 4395A and 4396B
5966-4099E.pdf
- Dramatic Speed improvement for Narrow RBW Sweeps . . .
04395-90010.pdf
- Operation manual
04395-90011.pdf
- Programming manual
Plug&Play
Instrument Drivers - has HP 4395A Network/Spectrum/Impedance
10 Hz to 500 MHz Analyzer: win95, winNT (4395a.exe A.1.0.00.01
Oct-19-1998)
Note most Agilent Plug & Play instrument drivers
include LabVIEW capability.
VNA Help -
Panadapters
- a precursor to the spectrum analyzer - Patents:
2273914
- Radio Navigation System, Feb 24, 1942, M. Wallace 342/462;
310/318;
310/350;
361/298.1
2279151
- Panoramic Radio Receiving System, Apr 7, 1942, M. Wallace 342/455;
334/20;
334/33;
346/37;
455/148
Firmware
Re: HP4395A - options upgrade
From: Hristo the complete method
4395A_OptionsUpgrade.pdf
Scalar Analyzers
Scalar Analyzers are very similar
instruments that have a graphical display of things like
transmission loss or return loss vs. frequency.
It turns out that when a bridge is used for return loss along with
an air line that has a known mismatch the accuracy of the
resultant measurement is better than what's available from a
network analyzer. (that is not a typo). The reason is that
the precision of the mismatched air line is determined by physical
measurements, i.e. very accurate and the overall accuracy of the
measurement depends on the mismatch of the air line interacting
with the unknown reflection coefficient. Note the mismatch
of the bridge effects the appearance of the measurement, but not
the measurement itself.
If you look at a network analyzer plot of S11 with the bridge and
air line what you see is a circle the radius of which depends on
the relative mismatch between the bridge and termination, but the
center of that circle is the impedance of the air line. With
precision machining and temperature control that center point is
much more accurate than a vector network analyzer after making the
full calibration and error corrections.
Scalar analyzers are just AC detectors, very similar to the
415 SWR meter except they work with a
swept RF source. There's no RF in the SA box. They are
a big step up from using a sweeper and an oscilloscope driven by a
detector and a grease pencil to make a calibration mark on the
scope face. The storage normalizer was the bridge box
between the grease pencil and the scalar network analyzer but that
didn't last more than a year or so. The ability of the 8756
(and 8757) to remember the calibration and so display a straight
line for 0 dB either through or reflected and a screen calibrated
in dB was a huge improvement over the grease pencil where
calibrated pads were needed to get amplitude calibration and a
wavemeter was needed to determine frequency.
Related
ADSB
&Raspberry Pi
Agilent
E4404B ESA-E 9kHz - 6.7 GHz Spectrum Analyzer
Avcom PSA-45D Portable Spectrum Analyzer
HP
71100C 2.9 GHz Spectrum Analyzer
HP
8702B Lightwave Component Analyzer,
Electro Optical Network Analyzer -
Optical
Spectrum Analyzers
Test
Equipment - Microwave
Test Equipment - Spectrum
Analyzers & some 70000 info
Z - Impedance
Zo - Transmission Line Zo vs. Frequency
Links
Back to Brooke's Test Equipment, Microwave Test Equipment, Electronics, Home
page
Page created 28 Feb 2001.

